
sysbench
sysbench是一款压力测试工具,可以测试系统的硬件性能,也可以用来对数据库进行基准测试
wget https://github.com/akopytov/sysbench/archive/1.0.zip -O "sysbench-1.0.zip" 下载之后的名字是1.0.zip。解压之后为sysbench-1.0
百度云网盘:https://pan.baidu.com/s/1mjoa25y 密码:i4pm
cd sysbench-1.0
执行autogen.sh用它来生成configure这个文件
./autogen.sh

执行configure && make && make install 来完成sysbench的安装
./configure && make && make install 这个命令是用于mysql默认的安装路径
./configure --prefix=/usr/local/sysbench/ --with-mysql --with-mysql-includes=/usr/local/mysql/include --with-mysql-libs=/usr/local/mysql/lib 这个是用于指定mysql安装的路径(我的mysql是默认路径,所以我用第一种)
当然了,用上面的参数编译的话,就要确保你的 MySQL lib目录下有对应的 so 文件,如果没有,可以自己下载 devel 或者 share 包来安装。
另外,如果想要让 sysbench 支持 pgsql/oracle 的话,就需要在编译的时候加上参数
--with-pgsql
或者
--with-oracle
这2个参数默认是关闭的,只有 MySQL 是默认支持的


执行之后出现这个错误
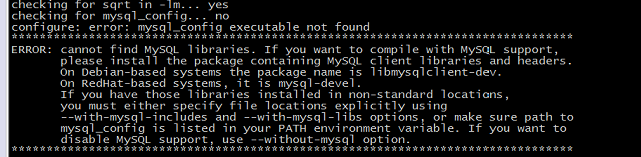
这是缺少MySQL头文件和库文件
centos6用:
yum install MySQL-shared
yum install MySQL-devel
centos7用:
yum install -y Percona-XtraDB-Cluster-shared-56.x86_64
yum install -y Percona-XtraDB-Cluster-devel-56
重新 ./configure && make && make install
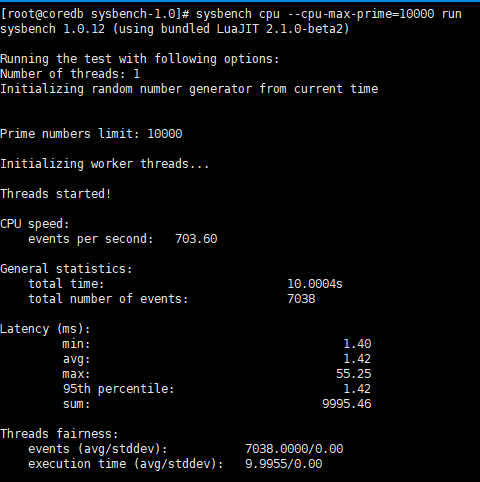
测试:sysbench cpu --cpu-max-prime=10000 run
出现这个就是成功
sysbench支持以下几种测试模式:
1、CPU运算性能 2、磁盘IO性能 3、调度程序性能 4、内存分配及传输速度 5、POSIX线程性能 6、数据库性能(OLTP基准测试) 目前sysbench主要支持 mysql,drizzle,pgsql,oracle 等几种数据库。
三、OLTP测试前准备
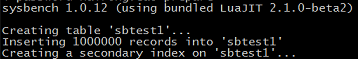
初始化测试库环境(总共10个测试表,每个表 100000 条记录,填充随机生成的数据):
cd /tmp/sysbench-0.4.12-1.1/sysbench
mysqladmin create sbtest

./sysbench --mysql-host=1.2.3.4 --mysql-port=3317 --mysql-user=tpcc --mysql-password=tpcc \
 --test=tests/db/oltp.lua --oltp_tables_count=10 --oltp-table-size=100000 --rand-init=on prepare
关于这几个参数的解释:
--test=tests/db/oltp.lua 表示调用 tests/db/oltp.lua 脚本进行 oltp 模式测试
--oltp_tables_count=10 表示会生成 10 个测试表
--oltp-table-size=100000 表示每个测试表填充数据量为 100000
--rand-init=on 表示每个测试表都是用随机数据来填充的
如果在本机,也可以使用 –mysql-socket 指定 socket 文件来连接。加载测试数据时长视数据量而定,若过程比较久需要稍加耐心等待。
真实测试场景中,数据表建议不低于10个,单表数据量不低于500万行,当然了,要视服务器硬件配置而定。如果是配备了SSD或者PCIE SSD这种高IOPS设备的话,则建议单表数据量最少不低于1亿行。
四、进行OLTP测试
在上面初始化数据参数的基础上,再增加一些参数,即可开始进行测试了:
./sysbench --mysql-host=1.2.3.4. --mysql-port=3306 --mysql-user=tpcc \
--mysql-password=tpcc --test=tests/db/oltp.lua --oltp_tables_count=10 \
--oltp-table-size=10000000 --num-threads=8 --oltp-read-only=off \
--report-interval=10 --rand-type=uniform --max-time=3600 \
 --max-requests=0 --percentile=99 run >> ./log/sysbench_oltpX_8_20140921.log
几个选项稍微解释下
--num-threads=8 表示发起 8个并发连接
--oltp-read-only=off 表示不要进行只读测试,也就是会采用读写混合模式测试
--report-interval=10 表示每10秒输出一次测试进度报告
--rand-type=uniform 表示随机类型为固定模式,其他几个可选随机模式:uniform(固定),gaussian(高斯),special(特定的),pareto(帕累托)
--max-time=120 表示最大执行时长为 120秒
--max-requests=0 表示总请求数为 0,因为上面已经定义了总执行时长,所以总请求数可以设定为 0;也可以只设定总请求数,不设定最大执行时长
--percentile=99 表示设定采样比例,默认是 95%,即丢弃1%的长请求,在剩余的99%里取最大值
即:模拟 对10个表并发OLTP测试,每个表1000万行记录,持续压测时间为 1小时。
真实测试场景中,建议持续压测时长不小于30分钟,否则测试数据可能不具参考意义
五、测试结果解读:
sysbench 0.5:  multi-threaded system evaluation benchmark

Running the test with following options:
Number of threads: 8
Report intermediate results every 10 second(s)
Random number generator seed is 0 and will be ignored


Threads started!
-- 每10秒钟报告一次测试结果,tps、每秒读、每秒写、99%以上的响应时长统计
[  10s] threads: 8, tps: 1111.51, reads/s: 15568.42, writes/s: 4446.13, response time: 9.95ms (99%)
[  20s] threads: 8, tps: 1121.90, reads/s: 15709.62, writes/s: 4487.80, response time: 9.78ms (99%)
[  30s] threads: 8, tps: 1120.00, reads/s: 15679.10, writes/s: 4480.20, response time: 9.84ms (99%)
[  40s] threads: 8, tps: 1114.20, reads/s: 15599.39, writes/s: 4456.30, response time: 9.90ms (99%)
[  50s] threads: 8, tps: 1114.00, reads/s: 15593.60, writes/s: 4456.70, response time: 9.84ms (99%)
[  60s] threads: 8, tps: 1119.30, reads/s: 15671.60, writes/s: 4476.50, response time: 9.99ms (99%)
OLTP test statistics:
    queries performed:
        read:                            938224    -- 读总数
        write:                           268064    -- 写总数
        other:                           134032    -- 其他操作总数(SELECT、INSERT、UPDATE、DELETE之外的操作,例如COMMIT等)
        total:                           1340320    -- 全部总数
    transactions:                        67016  (1116.83 per sec.)    -- 总事务数(每秒事务数)
    deadlocks:                           0      (0.00 per sec.)    -- 发生死锁总数
    read/write requests:                 1206288 (20103.01 per sec.)    -- 读写总数(每秒读写次数)
    other operations:                    134032 (2233.67 per sec.)    -- 其他操作总数(每秒其他操作次数)

General statistics:    -- 一些统计结果
    total time:                          60.0053s    -- 总耗时
    total number of events:              67016    -- 共发生多少事务数
    total time taken by event execution: 479.8171s    -- 所有事务耗时相加(不考虑并行因素)
    response time:    -- 响应时长统计
         min:                                  4.27ms    -- 最小耗时
         avg:                                  7.16ms    -- 平均耗时
         max:                                 13.80ms    -- 最长耗时
         approx.  99 percentile:               9.88ms    -- 超过99%平均耗时

Threads fairness:
    events (avg/stddev):           8377.0000/44.33
    execution time (avg/stddev):   59.9771/0.00

其他信息可以参考这个连接:
http://www.linuxidc.com/Linux/2017-04/142856.htm

实时操作:
 /usr/local/bin/sysbench oltp_common --mysql-host=10.1.18.74 --mysql-port=3306  --table-size=1000000 --db-driver=mysql --mysql-db=test --mysql-user=root--mysql-password=root prepare  此命令用来生成表
oltp_common #生成库的脚本
--mysql-db=test#指定库
prepare #运行的命令
--oltp_tables_count=10 用来指定生成多少张表
/usr/local/bin/sysbench oltp_read_only --mysql-host=10.1.18.74 --mysql-port=3306 --table-size=1000 --db-driver=mysql --mysql-db=test --mysql-user=root --mysql-password=root --time=10 --max-requests=0 --threads=8 run 这是运行
oltp_read_only #指定只读脚本
--mysql-db=test #指定运行的库
--threads=8 #指定并发连接数
run #运行指令
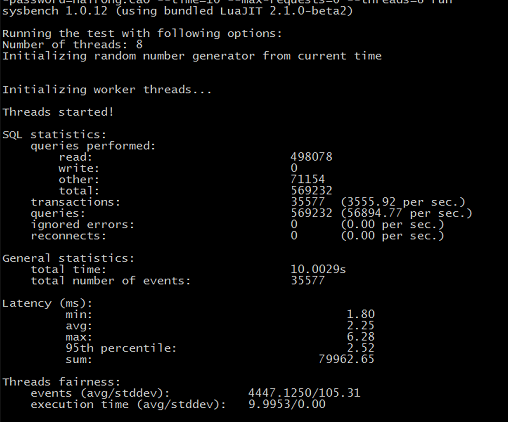
/usr/local/bin/sysbench oltp_write_only --mysql-host=10.1.18.74 --mysql-port=3306 --table-size=1000 --db-driver=mysql --mysql-db=test --mysql-user=hairong.cao --mysql-password=hairong.cao --time=10 --max-requests=0 --threads=8 run
oltp_write_only #指定只写脚本
生成表:
/usr/local/bin/sysbench tests/include/oltp_legacy/oltp.lua --mysql-host=10.1.18.74 --mysql-port=3306 --oltp_tables_count=8 --table-size=10000000 --db-driver=mysql --mysql-db=test --mysql-user=hairong.cao --mysql-password=hairong.cao prepare
混合场景压测:
/usr/local/bin/sysbench tests/include/oltp_legacy/oltp.lua --mysql-host=10.1.18.74 --mysql-port=3306 --table-size=10000000 --db-driver=mysql --mysql-db=test --mysql-user=root --mysql-password=root --oltp_tables_count=8 --max-requests=0 --threads=32 --oltp-read-olny=off --report-interval=10 --percentile=99 --max-time=3600 run >> ./logs/baidu.log
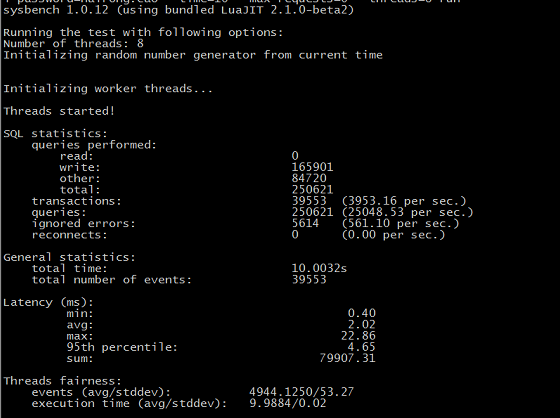
cpu测试:
/usr/local/bin/sysbench --test=cpu --num-threads=40 --max-requests=10000 --cpu-max-prime=20000 run
IO测试:
生成测试文件; /usr/local/bin/sysbench --test=fileio --file-num=10 --file-total-size=5G prepare 表示生成10个5G的文件
运行测试: /usr/local/bin/sysbench --test=fileio --file-total-size=5G --file-test-mode=rndrw --max-requests=5000 --num-threads=16 --file-num=10 --file-extra-flags=direct --file-fsync-freq=0 --file-block-size=16384 run
参数说明: --max-requests=5000 表示5000请求量
--num-threads=16 16个线程
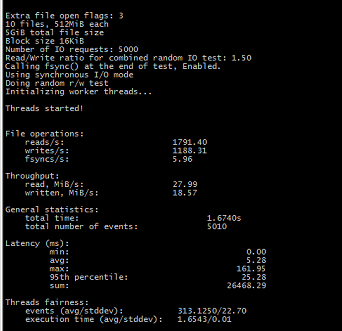
File operations:
reads/s: 1791.40 表示每秒读的次数
writes/s: 1188.31 表示每秒写的次数
fsyncs/s: 5.96 表示每秒从内存向磁盘同步的次数
Throughput:
read, MiB/s: 27.99 这里表示读的带宽
written, MiB/s: 18.57 这里表示写的带宽
MySQL读写速度慢从外部分析原因:
待续
