马蜂窝泉州热门景点分析
一、1.主题式网络爬虫名称:马蜂窝泉州热门景点分析
2.主题式网络爬虫爬取的内容与数据特征分析:爬取马蜂窝泉州热门景点信息,提取景点名字和蜂评数进行数据分析。
3.主题式网络爬虫设计方案概述(包括实现思路与技术难点):request发送请求,BeautifulSoup解析html网页获取所需信息,进行数据清洗,画出景点名称与蜂评数的柱状图,创立方程画出散点图。(最后画不出拟合曲线也许是数据采取过少或者错误)
二、主题页面的结构特征分析
1.主题页面的结构与特征分析
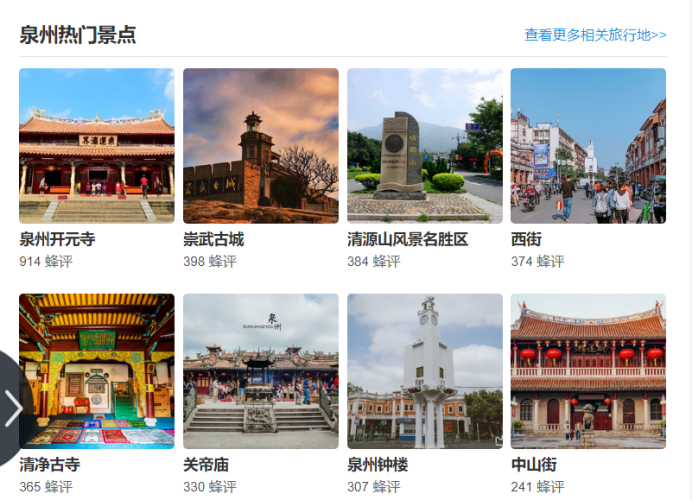
所需要获取的数据位置
2.Htmls页面解析
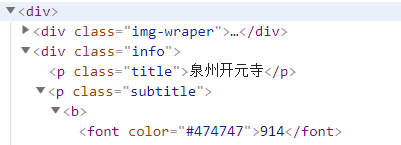
查看标签景点名称发现标题在p class=’title’下,蜂评数在font 标签下

3.节点(标签)查找方法与遍历方法

->
->
->
->
->-
>
三、网络爬虫程序设计
爬虫程序主体要包括以下各部分,要附源代码及较详细注释,并在每部分程序后面提供输出结果的截图。
1.数据爬取与采集
def get(url,list,num): #定义一个获取信息函数
    headers = {'user-agent':'Mo+zilla/5.0 (Windows; U; Windows NT 5.1; it; rv:1.8.1.11) Gecko/20071127 Firefox/2.0.0.11'} #伪装爬虫 不然无法爬取网页信息

    r = requests.get(url,timeout = 30,headers=headers)  #发送请求 时间为30s

    r.raise_for_status()
    r.encoding = r.apparent_encoding

    soup = BeautifulSoup(r.text,"html.parser") #html编译器

    list1 = []
    list2 = []  #创建两个列表存放景点名字和蜂评数的信息

    list1 = soup.find_all('p',class_='title')  #寻找标签为p的数据
    list2 = soup.find_all('font',color="#474747") #寻找标签为font,color="#474747"的数据

    print("{:^10}\t{:^30}\t{:^10}\t".format('排名','景点名字','蜂评数'))

    for i in range(num):
        list.append([i+1,list1[i].string,list2[i].string])
        print("{:^10}\t{:^30}\t{:^10}\t".format(i+1,list1[i].string,list2[i].string))  #将数据添加入list数组中

2.对数据进行清洗和处理
def check_file(file_path):
    quanzhou = pd.DataFrame(pd.read_excel('D:\python\quanzhou.xlsx'))
    print('\n====各列的空值情况如下:====')
    print(quanzhou.isnull()) #统计空值情况
    print(quanzhou.duplicated()) #查找重复值
    print(quanzhou.isna().head()) #统计缺失值  # 得出结果为False则不为空值

    print(quanzhou.describe()) #描述数据
空值: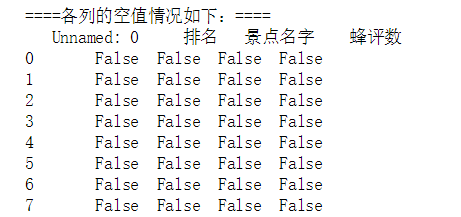
重复值: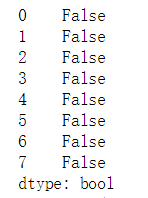
缺失值:
describe:

4.数据分析与可视化(例如:数据柱形图、直方图、散点图、盒图、分布图)
 1 def chart():
 2     plt.rcParams['font.sans-serif']=['SimHei'] #设置字体
 3
 4     filename = 'D:\python\quanzhou.xlsx'
 5     colnames=['排名','景点名字','蜂评数']
 6     df = pd.read_excel(filename)
 7
 8     X=df.loc[1:8,'景点名字']
 9     Y=df.loc[1:8,'蜂评数']
10
11     plt.bar(X,Y)
12     plt.title("泉州热门景点柱状图")
13     plt.show
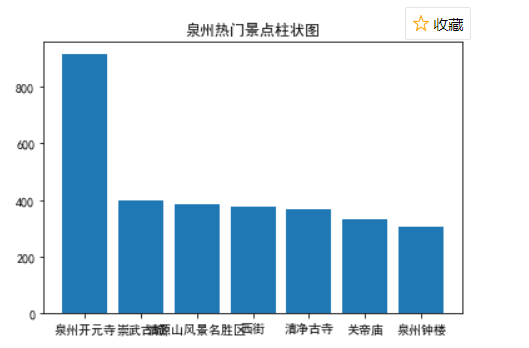
5.根据数据之间的关系,分析两个变量之间的相关系数,画出散点图,并建立变量之间的回归方程(一元或多元。
 1 def chart2():
 2     plt.rcParams['font.sans-serif'] = ['SimHei']
 3
 4     df = pd.read_excel('D:\python\quanzhou.xlsx')
 5
 6     X=df.loc[1:8,'排名'] #用排名1到8来代表景点名字
 7     Y=df.loc[1:8,'蜂评数']
 8
 9     def func(p,x):  #建立一元二次函数
10         a,b,c = p
11         return a * x * x  + b * x + c
12     def error(p,x,y):
13         return func(p,x)- y
14
15     plt.figure()
16     p0=[1,1,1]
17     P = leastsq(error,p0,args=(X,Y))
18     a,b,c = P[0]
19     print("a=",a,"b=",b,"c=",c)
20
21     plt.scatter(X,Y,color="green",label="样本数据",linewidth = 2)
22
23     x = np.linspace(1,8,1)
24     y = a * x * x + b * x + c
25
26     plt.plot(x,y,color="red",label="拟合曲线",linewidth = 2)
27     plt.legend()
28     plt.title("泉州最受欢迎的景点")
29     plt.grid()
30     plt.show()
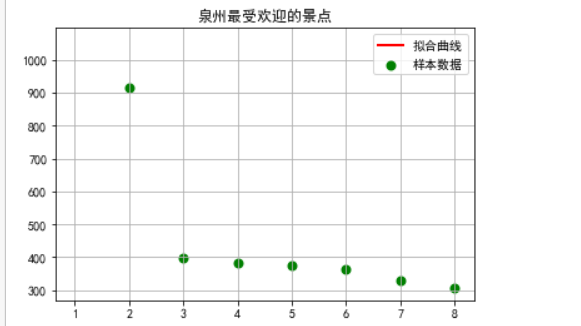 #用数字1-8来代表景点1-8位。
#可能是爬取的数据太少或者是不正确无法画出拟合曲线,实在找不出错误。
abc系数的值:
1 print(quanzhou.corr()) #两个变量的相关系数

6.数据持久化
1 def create_file(file_path,msg): #定义一个创建文件夹,将爬取的资源用excel格式打开
2     view =r'D:\python\quanzhou.xlsx'
3     df = pd.DataFrame(msg,columns=['排名','景点名字','蜂评数'])
4     df.to_excel(view)
5     print('创建excel完成')

7.将以上各部分的代码汇总,附上完整程序代码
  1 import requests
  2 from bs4 import BeautifulSoup
  3 import pandas as pd
  4 import numpy as np
  5 import scipy as sp
  6 from numpy import genfromtxt
  7 import matplotlib
  8 from pandas import DataFrame
  9 import matplotlib.pyplot as plt
 10 from scipy.optimize import leastsq
 11
 12 def get(url,list,num): #定义一个获取信息函数
 13     headers = {'user-agent':'Mo+zilla/5.0 (Windows; U; Windows NT 5.1; it; rv:1.8.1.11) Gecko/20071127 Firefox/2.0.0.11'} #伪装爬虫 不然无法爬取网页信息
 14
 15     r = requests.get(url,timeout = 30,headers=headers)  #发送请求 时间为30s
 16
 17     r.raise_for_status()
 18     r.encoding = r.apparent_encoding
 19
 20     soup = BeautifulSoup(r.text,"html.parser")
 21
 22     list1 = []
 23     list2 = []  #创建两个列表存放景点名字和蜂评数的信息
 24
 25     list1 = soup.find_all('p',class_='title')  #寻找标签为p的数据
 26     list2 = soup.find_all('font',color="#474747") #寻找标签为font,color="#474747"的数据
 27
 28     print("{:^10}\t{:^30}\t{:^10}\t".format('排名','景点名字','蜂评数'))
 29
 30     for i in range(num):
 31         list.append([i+1,list1[i].string,list2[i].string])
 32         print("{:^10}\t{:^30}\t{:^10}\t".format(i+1,list1[i].string,list2[i].string))  #将数据添加入list数组中
 33
 34 def create_file(file_path,msg): #定义一个创建文件夹,将爬取的资源用excel格式打开
 35     view =r'D:\python\quanzhou.xlsx'
 36     df = pd.DataFrame(msg,columns=['排名','景点名字','蜂评数'])
 37     df.to_excel(view)
 38     print('创建excel完成')
 39
 40 def check_file(file_path):
 41     quanzhou = pd.DataFrame(pd.read_excel('D:\python\quanzhou.xlsx'))
 42     print('\n====各列的空值情况如下:====')
 43     print(quanzhou.isnull()) #统计空值情况
 44     print(quanzhou.duplicated()) #查找重复值
 45     print(quanzhou.isna().head()) #统计缺失值  # 得出结果为False则不为空值
 46
 47     print(quanzhou.corr())  #两个变量的相关系数
 48     print(quanzhou.describe()) #打印出数据
 49
 50 def chart():
 51     plt.rcParams['font.sans-serif']=['SimHei'] #设置字体
 52
 53     filename = 'D:\python\quanzhou.xlsx'
 54     colnames=['排名','景点名字','蜂评数']
 55     df = pd.read_excel(filename)
 56
 57     X=df.loc[1:8,'景点名字']
 58     Y=df.loc[1:8,'蜂评数']
 59
 60     plt.bar(X,Y)
 61     plt.title("泉州热门景点柱状图")
 62     plt.show
 63
 64 def chart2():
 65     plt.rcParams['font.sans-serif'] = ['SimHei']
 66
 67     df = pd.read_excel('D:\python\quanzhou.xlsx')
 68
 69     X=df.loc[1:8,'排名'] #用排名1到8来代表景点名字
 70     Y=df.loc[1:8,'蜂评数']
 71
 72     def func(p,x):  #建立一元二次函数
 73         a,b,c = p
 74         return a * x * x  + b * x + c
 75     def error(p,x,y):
 76         return func(p,x)- y
 77
 78     plt.figure()
 79     p0=[1,1,1]
 80     P = leastsq(error,p0,args=(X,Y))
 81     a,b,c = P[0]
 82     print("a=",a,"b=",b,"c=",c)
 83
 84     plt.scatter(X,Y,color="green",label="样本数据",linewidth = 2)
 85
 86     x = np.linspace(1,8,1)
 87     y = a * x * x + b * x + c
 88
 89     plt.plot(x,y,color="red",label="拟合曲线",linewidth = 2)
 90     plt.legend()
 91     plt.title("泉州最受欢迎的景点")
 92     plt.grid()
 93     plt.show()
 94
 95 def main():
 96     list = []
 97     url = "http://www.mafengwo.cn/search/q.php?q=%E6%B3%89%E5%B7%9E"
 98     get(url,list,8)
 99     create_file('D:\python\quanzhou.xlsx',list)
100     check_file('D:\python\quanzhou.xlsx')
101     chart()
102     chart2()
103
104 main()
四、结论
1.经过对主题数据的分析与可视化,可以得到哪些结论?
在马蜂窝景点排行前八个中泉州开元寺最受游客欢迎。
2.对本次程序设计任务完成的情况做一个简单的小结。
懂得太少,这次程序作业应该完成了所给的任务。仍然还有一些错误,找不出解决方法,所取的数据过少导致无法画出拟合曲线,在这过程中也发现一些错误,list[]重置了输入的数据导致写入excel中为空数据。


