vue项目使用echarts实现区域地图绘制,且可点击单独区域
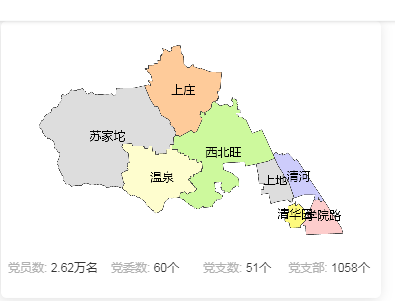
示例图


html:
<div id="main" class="map"></div>

js:
import echarts from "echarts";
import mapJson from "../../assets/beijing_haidian.json";


let _this = this;
    let myChart = echarts.init(document.getElementById("main"));
    echarts.registerMap("高平市", mapJson, {}); //
    var mapJsonlen = mapJson.features.length,
      data = mapJson.features;
    var color = [
      "#fecb9a",
      "#fefdce",
      "#fefa7d",
      "#cdccfb",
      "#cdf99d",
      "#fdcdcc"
    ];
    var mapData = mapJson.features.map((item, index) => {
      return {
        name: item.properties.name,
        value: 1000,
        level: item.properties.level,
        cityCode: item.properties.adcode,
        itemStyle: {
          normal: {
            show: true,
            areaColor: color[index] || "#ddd"
          }
        }
      };
    });
    let option = {
      series: [
        {
          name: "地图",
          type: "map",
          mapType: "高平市",
          aspectScale: 0.85, //地图长度比
          itemStyle: {
            normal: {
              show: true,
              areaColor: "#031525"
            }
          },
          label: {
            normal: {
              show: true,
              textStyle: {
                color: "#000"
              }
            }
          },
          data: mapData
        }
      ]
    };
    myChart.setOption(option);
    myChart.on("click", function(params) {
      _this.$router.push({
        path: "/street",
        query: { params: params.data.name }
      });
      console.log(params.data);
    });
需要的json数据可以通过这个地址去自己下载:http://datav.aliyun.com/tools/atlas/#&lat=35.81865973449193&lng=112.96011403587735&zoom=9.5

 浙公网安备 33010602011771号