
本章介绍使用Logstash收集Nginx访问日志
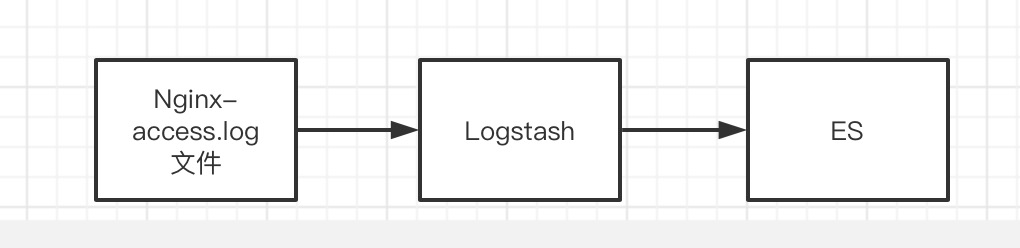
直接根据日志文件收集
流程:
1、准备nginx日志,日志格式如下:
1 log_format upstreaminfo
2             '$remote_addr - $remote_user [$time_local] "$request" '
3             '$status $body_bytes_sent "$http_referer" "$http_user_agent" '
4             '$request_length $request_time $upstream_addr '
5             '$upstream_response_length $upstream_response_time $upstream_status';
示例
196.168.0.4 - elastic [30/Jun/2020:22:32:47 +0800] "GET /_stats HTTP/1.1" 200 6097 "-" "Mozilla/5.0 (Macintosh; Intel Mac OS X 10_15_4) AppleWebKit/537.36 (KHTML, like Gecko) Chrome/83.0.4103.61 Safari/537.36"
2、编辑Logstash配置文件
命令:vim config/logstash-sample.conf,内容如下:
 1 input {
 2   # 输入文件
 3   file {
 4     path => "/data/logs/nginx-1.16.1/access.log"
 5     start_position => "beginning"
 6   }
 7 }
 8
 9 # 过滤器
10 filter {
11   # 根据路径判断 匹配正则
12   if [path] =~ "access" {
13     mutate { replace => { "type" => "nginx_access" } }
14     # grok 表达式
15     grok {
16       match => { "message" => "%{IPORHOST:remote_addr} - %{USERNAME:user} \[%{HTTPDATE:time_local}\] \"%{WORD:method} %{NOTSPACE:uri} HTTP/%{NUMBER:httpversion}\" %{NUMBER:status} %{NUMBER:body_bytes_sent} \"(%{GREEDYDATA:http_referer}|-)\" \"(%{GREEDYDATA:http_user_agent}|-)\"" }
17     }
18   }
19   # 增加时间戳字段
20   date {
21     match => [ "timestamp" , "dd/MMM/yyyy:HH:mm:ss Z" ]
22   }
23 }
24
25 # 输出
26 output {
27   # 输出es
28   elasticsearch {
29     hosts => ["http://127.0.0.1:9200"]
30     # 索引
31     index => "logstash-%{+YYYY.MM.dd}"
32     user => "elastic"
33     password => "123456"
34   }
35   # 输出控制台
36   stdout { codec => rubydebug }
37 }
注:
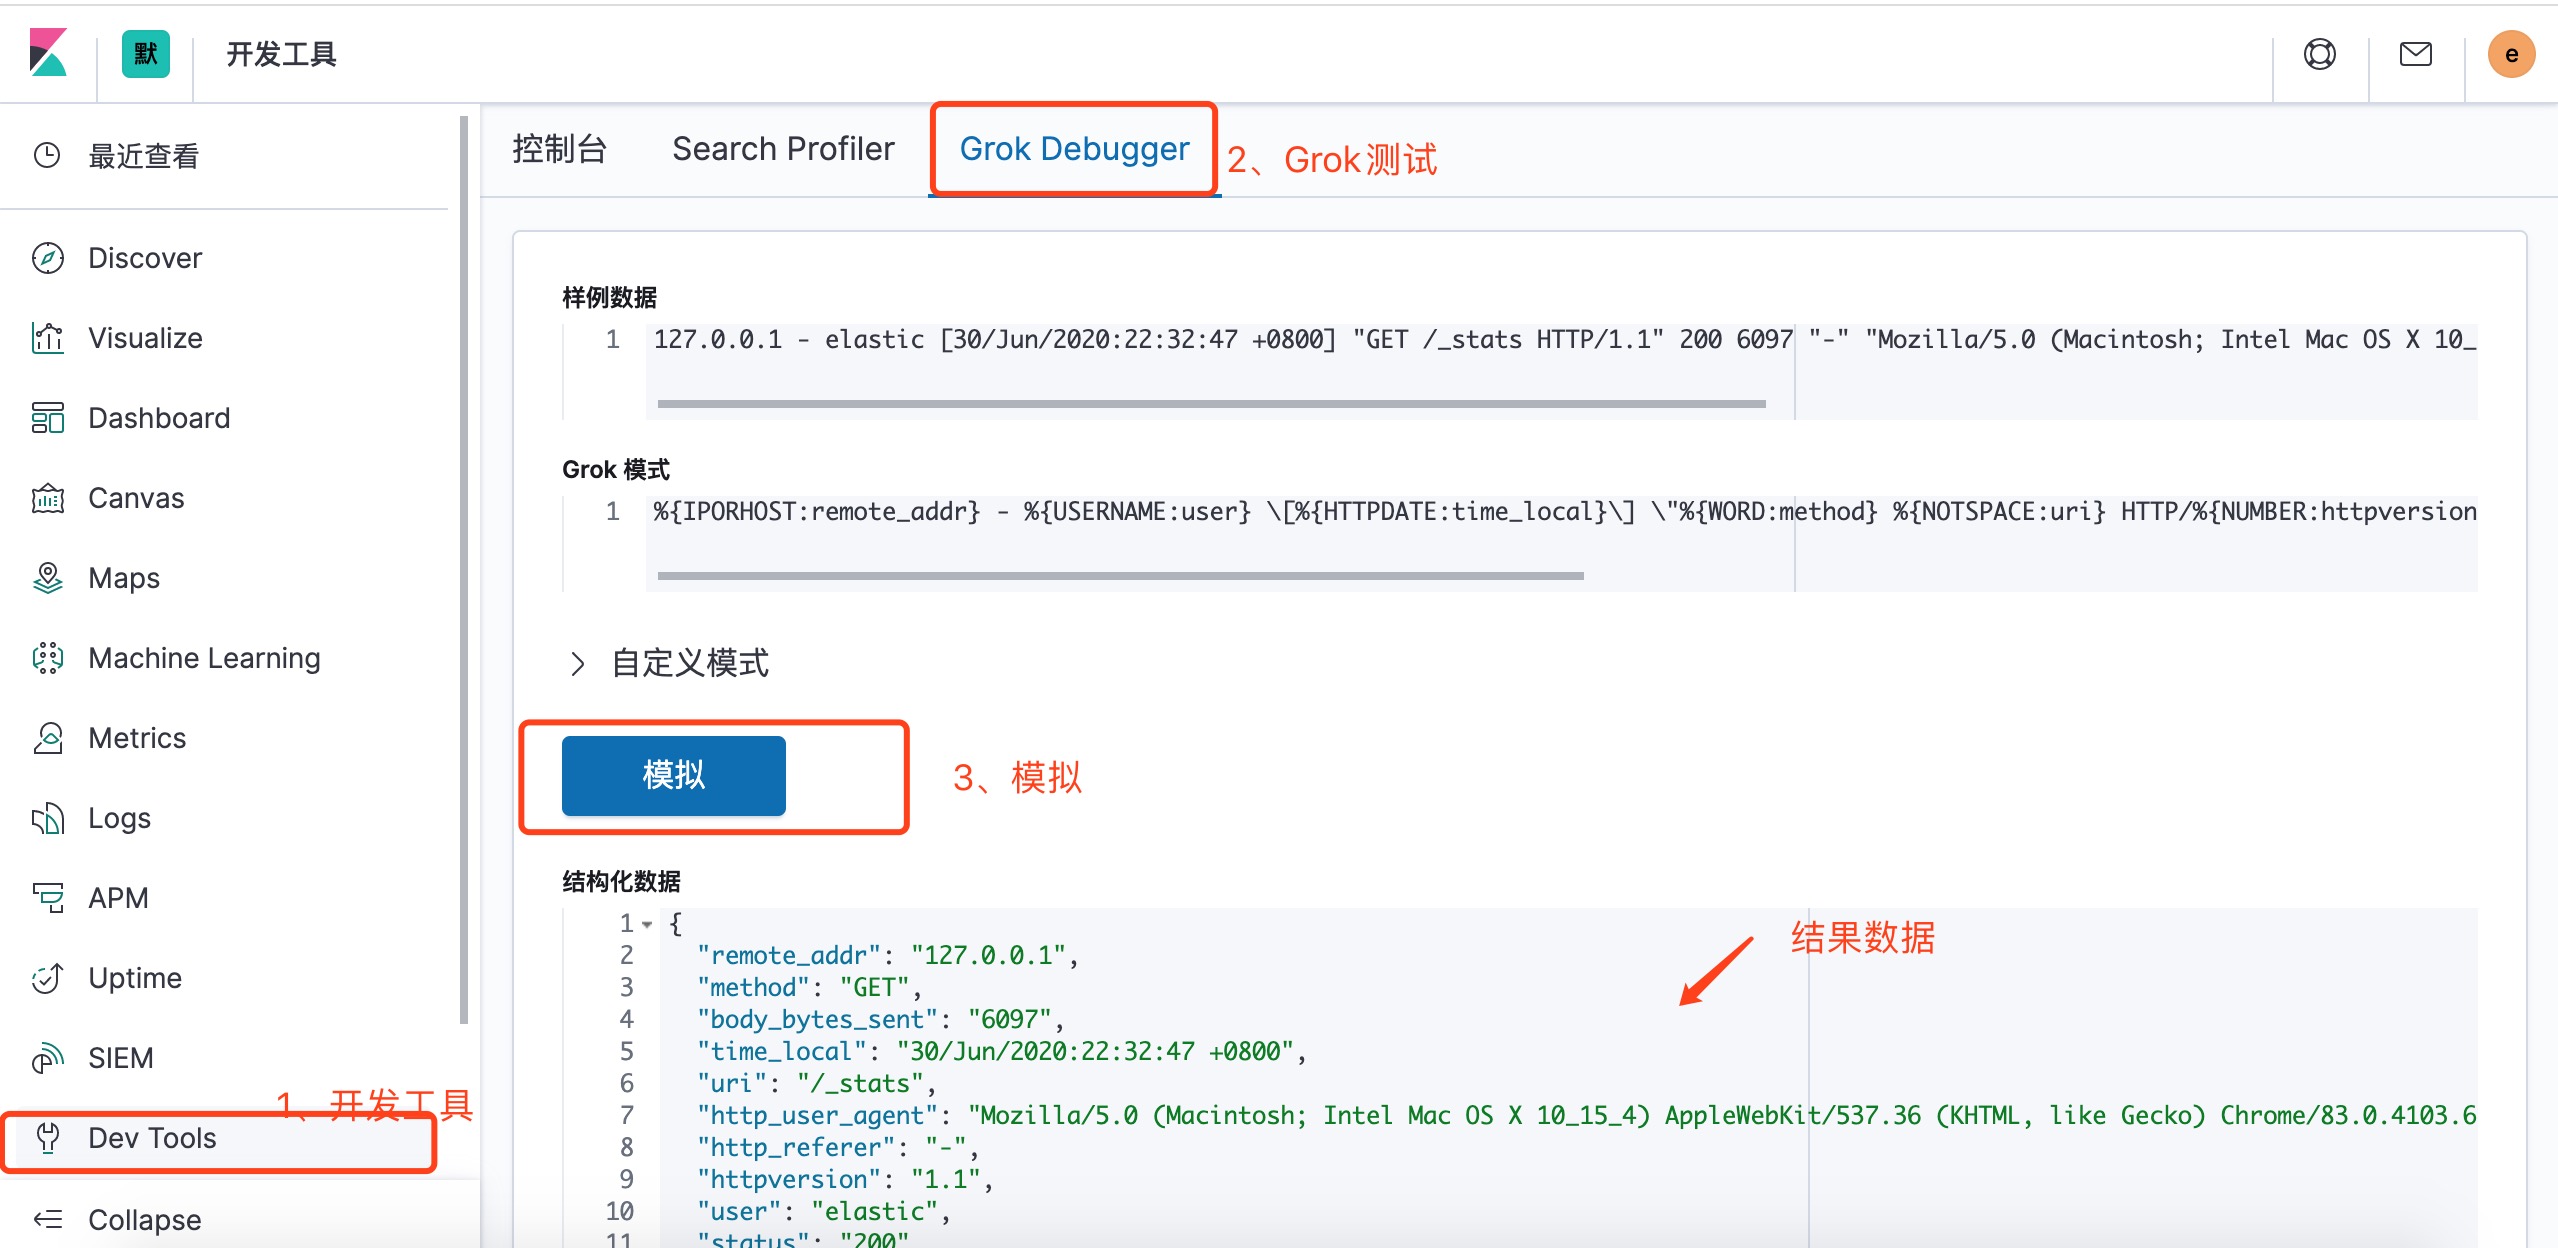
grok 表达式,可以在线测试地址:http://grokdebug.herokuapp.com/
或者在kibana的开发工具中进行测试,如下:
3、指定配置启动logstash
命令:./bin/logstash -f config/logstash-sample.conf
4、查看控台输出内容及ES索引内容
{
    "_index": "logstash-2020.06.30-000001",
    "_type": "_doc",
    "_id": "flPWBXMB0t-2xlrm4lZF",
    "_score": 1,
    "_source": {
        "remote_addr": "127.0.0.1",
        "@version": "1",
        "status": "200",
        "host": "H__D",
        "message": "127.0.0.1 - kibana [30/Jun/2020:23:26:10 +0800] \"GET /_nodes?filter_path=nodes.*.version%2Cnodes.*.http.publish_address%2Cnodes.*.ip HTTP/1.1\" 200 233 \"-\" \"-\"",
        "method": "GET",
        "type": "nginx_access",
        "body_bytes_sent": "233",
        "@timestamp": "2020-06-30T15:27:14.720Z",
        "http_user_agent": "-",
        "user": "kibana",
        "time_local": "30/Jun/2020:23:26:10 +0800",
        "http_referer": "-",
        "uri": "/_nodes?filter_path=nodes.*.version%2Cnodes.*.http.publish_address%2Cnodes.*.ip",
        "path": "/data/logs/nginx-1.16.1/access.log",
        "httpversion": "1.1"
    }
}
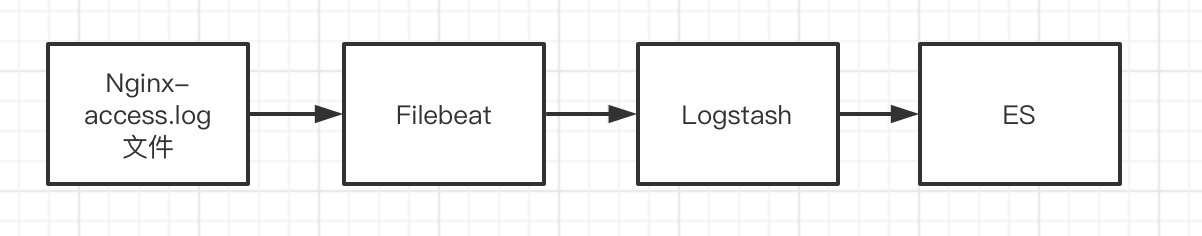
有Filebeat输入日志文件收集
流程:
1、准备Nginx日志,同上
2、编辑Logstash配置文件
命令:vim config/logstash-beats.conf,内容如下
 1 input {
 2   # beats 输入,logstash监听端口5044
 3   beats {
 4     port => 5044
 5   }
 6 }
 7
 8 # 过滤器
 9 filter {
10   # 根据路径判断 匹配正则
11   if [log][file][path] =~ "access" {
12     mutate { replace => { "type" => "nginx_access" } }
13     # grok 语法
14     grok {
15       match => { "message" => "%{IPORHOST:remote_addr} - %{USERNAME:user} \[%{HTTPDATE:time_local}\] \"%{WORD:method} %{NOTSPACE:uri} HTTP/%{NUMBER:httpversion}\" %{NUMBER:status} %{NUMBER:body_bytes_sent} \"(%{GREEDYDATA:http_referer}|-)\" \"(%{GREEDYDATA:http_user_agent}|-)\"" }
16     }
17   }
18   # 增加时间戳字段
19   date {
20     match => [ "timestamp" , "dd/MMM/yyyy:HH:mm:ss Z" ]
21   }
22 }
23
24 # 输出
25 output {
26   # 输出es
27   elasticsearch {
28     hosts => ["http://127.0.0.1:9200"]
29     # 索引
30     index => "logstash-%{+YYYY.MM.dd}"
31     user => "elastic"
32     password => "123456"
33   }
34   # 输出控制台
35   stdout { codec => rubydebug }
36 }
3、启动Logstash
命令:./bin/logstash -f config/logstash-beats.conf
4、编辑Filebeat配置文件
命令:vim test-logstash.yml
 1 # 输入
 2 filebeat.inputs:
 3 - type: log
 4   enabled: true
 5   paths:
 6     - /data/logs/nginx-1.16.1/access.log
 7
 8 # 输出到logstash
 9 output.logstash:
10   hosts: ["localhost:5044"]
5、启动Filebeat命令
命令:./filebeat -e -c test-logstash.yml -d "publish"
6、查看es数据,内容如下:
 1 {
 2     "_index": "logstash-2020.06.30-000001",
 3     "_type": "_doc",
 4     "_id": "6lMcBnMB0t-2xlrmOH95",
 5     "_score": 1,
 6     "_source": {
 7         "httpversion": "1.1",
 8         "time_local": "01/Jul/2020:00:40:48 +0800",
 9         "user": "kibana",
10         "remote_addr": "127.0.0.1",
11         "body_bytes_sent": "233",
12         "status": "200",
13         "ecs": {
14             "version": "1.4.0"
15         },
16         "type": "nginx_access",
17         "tags": [
18             "beats_input_codec_plain_applied"
19         ],
20         "method": "GET",
21         "message": "127.0.0.1 - kibana [01/Jul/2020:00:40:48 +0800] \"GET /_nodes?filter_path=nodes.*.version%2Cnodes.*.http.publish_address%2Cnodes.*.ip HTTP/1.1\" 200 233 \"-\" \"-\"",
22         "log": {
23             "offset": 926975,
24             "file": {
25                 "path": "/data/logs/nginx-1.16.1/access.log"
26             }
27         },
28         "host": {
29             "name": "H__D"
30         },
31         "http_referer": "-",
32         "agent": {
33             "hostname": "H__D",
34             "type": "filebeat",
35             "id": "9f14c4db-2f85-4740-8183-36f475ffdfed",
36             "version": "7.6.1",
37             "ephemeral_id": "936690f4-7be0-4072-918d-1a1d3fae2d4b"
38         },
39         "input": {
40             "type": "log"
41         },
42         "@timestamp": "2020-06-30T16:40:48.795Z",
43         "uri": "/_nodes?filter_path=nodes.*.version%2Cnodes.*.http.publish_address%2Cnodes.*.ip",
44         "@version": "1",
45         "http_user_agent": "-"
46     }
47 }


 浙公网安备 33010602011771号