可观测性应用
1,Istio的可观测性
1.1
Metrics:Istio会为所有服务的流量和自身控制平面的各组件生成详细的指标;但究竟要收集哪些指标则由运维人员通过配置来确定;
1.1.1 Proxy-level metrics:代理级指标,数据平面指标
Envoy Proxy会为出入的所有流量生成丰富的一组指标
Envoy Proxy还会生成自身管理功能的详细统计信息,包括配置和运行状态等
1.1.2 Service-level metrics:服务指标,用于监控服务通信,数据平面指标
面向服务的指标主要包括服务监视的四个基本需求:延迟、流量、错误和饱和度;
1.1.3 Control plane metrics,控制平面指标
istiod还提供了一组自我监控的指标,这些指标允许监控Istio自身的行为;
1.2
Distributed Traces
Istio支持通过代理程序Envoy进行分布式跟踪
这意味着被代理的应用程序只需要转发适当的context即可,实现了“近零侵入”
支持Zipkin、Jaeger、LightStep和Datadog等后端系统
支持运维人员自定义采样频率
1.3
Access Log
访问日志提供了从单个workload级别监视和了解服务行为的方法
日志格式可由运维人员按需进行定义,且可把日志导出到自定义的后端,例如Fluentd等;
1,了解Envoy启用的统计指标
相关的端点:/stats和/stats/prometheus
获取命令
envoy_server_initialization_time_ms_count{} 1
root@slave001:~# curl 10.200.163.112:15020/stats/prometheus
[root@demoappv10-6ff964cbff-45qqt /]# curl 127.0.0.1:15000/stats/prometheus
root@master001:~# kubectl exec demoappv10-6ff964cbff-45qqt -c istio-proxy -- pilot-agent request GET /stats
查看启用的统计指标
root@master001:~# istioctl proxy-config bootstrap demoappv10-6ff964cbff-45qqt.default | jq .bootstrap.statsConfig
2,在网格上配置代理级指标
在网格上启用更多的统计指标
Istio上与网格代理相关的默认配置定义在MeshConfig.defaultConfig配置段中,而每个Pod之上Sidecar Envoy的指标定义则要通过Annotations完成
要自定义启用的统计指标可以使用MeshConfig.defautConfig.proxyStatsMatcher进行定义
inclusionRegexps:基于正则表达式模式指定要启用的统计指标键
inclusionPrefixes:基于前缀匹配指定要启用的统计指标键
inclusionSuffixes:基于后缀匹配指定要启用的统计指标键
git clone https://github.com/iKubernetes/istio-in-practise.git
root@slave002:/opt/istio-in-practise/Observability/Proxy-Level# cat demo1.yaml #重新添加
apiVersion: install.istio.io/v1alpha1
kind: IstioOperator
spec:
  profile: demo
  meshConfig:
    accessLogFile: /dev/stdout
    defaultConfig:
      proxyMetadata: {}
      proxyStatsMatcher:
        inclusionRegexps:
          - ".*circuit_breakers.*"
        inclusionPrefixes:
          - "upstream_rq_retry"
          - "upstream_cx"
root@slave002:/opt/istio-in-practise/Observability/Proxy-Level# istioctl install -f demo1.yaml
This will install the Istio 1.12.0 demo profile with ["Istio core" "Istiod" "Ingress gateways" "Egress gateways"] components into the cluster. Proceed? (y/N)
root@slave002:# kubectl run client777 --image=ikubernetes/admin-box:latest  -it --rm --restart=Never --command -- /bin/bash
while true;do curl proxy;sleep 1;done
root@master001:~/istio/istio-1.12.0/manifests/profiles/bak# istioctl profile dump demo
3,服务级指标
3.1 Istio暴露的服务级指标用于监控服务间通信
这类指标涵盖了服务监控的四个基本需求:延迟、流量、错误和饱和度
Istio默认配置了一组服务指标(通常也可称为标准指标),并将这些指标导出至Prometheus监控系统
1.5版本因性能舍弃Mixer之后(原因,每个Envoy Sidecar和Mixer之间都需要维护一个活动连接),Istio的这些服务指标则由Envoy代理通过Proxy-wasm插件直接导出
serviceA
envoy proxy (plugin定义收集指标)
proxy-level metrics
prometheus
3.2 服务级指标的新实现 Telemetry V2
实现路径:将服务级指标的实现借助于特定“extension”移入Envoy
目标:以被动收集方式实现,从而减少资源消耗,并降低延迟;
实现方式
静态预编译:需要使用C++编写相关的Filter,并集成到Envoy的源码中,因而需要重新编译和滚动更新
动态运行时加载:支持基于WASM(WebAssembly)来动态加载Filter,完成Envoy扩展
Istio Telemetry V2使用两个自定义的Envoy插件实现服务级指标
metadata-exchange
用于提供有关连接双方(Client/Server)的元数据
HTTP流量:使用自定义标头envoy.wasm.metadata_exchange.upstream和envoy.wasm.metadata_exchange.downstream
TCP流量:使用基于ALPN的隧道和基于前缀的协议,istio-peer-exchange
stats
负责将传入和传出的流量指标记录到Envoy统计子系统中,并使其可供Prometheus抓取
stats源码:https://github.com/istio/proxy/tree/master/extensions/stats
相关指标定义在plugin.cc文件的MetricFactory中
其暴露的指标称为标准服务指标或默认服务指标
Telemetry V2架构中的Metadata Exchange和Stats插件
Istio默认启用的服务级指标,是在首次部署Istio时由通过自动创建的EnvoyFilter资源定义的
这些EnvoyFilter资源定义在网格名称空间(例如istio system)下
获取命令:~$ kubectl get envoyfilters -n istio-system
以envoyfiler/stats-filter-1.12资源为例,右侧是配置片断
该EnvoyFilter用于配置名为envoy.wasm.stats的过滤器
各指标为自动添加一个istio前缀
三种类型的Envoy实例需要经context匹配后分别进行配置
SIDECAR_OUTBOUND
SIDECAR_INBOUND
GATEWAY
注意
出于性能的考虑,该Wasm插件是直接编译进Envoy的,而非运行于Wasm VM中
但Istio也提供独立的stats Wasm插件,或要Istio将之运行为独立插件,可在部署istio时使用如下选项进行启用
--set values.telemetry.v2.prometheus.wasmEnabled=true
3.3 Istio的服务级指标
针对HTTP、HTTP/2和GRPC流量的指标
Request Count (istio_requests_total):处理的总请求数,COUNTER类型;
Request Duration (istio_request_duration_milliseconds):请求的持续时长,HISTOGRAM类型;
Request Size (istio_request_bytes):请求体大小,HISTOGRAM类型;
Response Size (istio_response_bytes):响应体大小,HISTOGRAM类型;
gRPC Request Message Count (istio_request_messages_total):gRPC连接,请求消息总数;
gRPC Response Message Count (istio_response_messages_total):gRPC连接,响应消息总数;
针对TCP流量的指标
Tcp Bytes Sent (istio_tcp_sent_bytes_total):在TCP连接中总共发送的字节数,COUNTER类型;
Tcp Bytes Received (istio_tcp_received_bytes_total):在TCP连接中总共接收的字节数,COUNTER类型;
Tcp Connections Opened (istio_tcp_connections_opened_total):总共打开的TCP连接数量,COUNTER类型;
Tcp Connections Closed (istio_tcp_connections_closed_total):总共关闭的TCP连接数量, COUNTER类型;
获取该Pod上的prometheus指标(由Envoy直接导出的prometheus格式的指标)
root@slave001:~# curl 10.200.163.111:15020/stats/prometheus |grep -o "istio_[a-zA-Z_]*" | sort -u
这些默认的服务级指标,可在部署Istio时,于IstioOperator资源配置中的values.telemetry.v2.prometheus配置段中进行修改
服务级指标相关的时间序列
Istio基于stats和metadata-exchange扩展,以及几个EnvoyFilter资源来控制指标的创建、配置及显示,这其中有三个重要概念
metric:指标名称
dimension:维度,标签
attribute:通信连接相关的属性,用作标签值
服务级指标的标识方式
通信双方
Server Workload:请求流量中的入站方(Inbound)
Client Workload:请求流量中的出站方(Outbound)
在同一个metric上使用不同的dimension,即代表着不同的时间序列
dimension中的各标签值来自于通信双方相关报文或连接的attribute
开放prometheus
root@master003:/opt/istio-in-practise/Traffic-Management-Basics# cat kiali/*
apiVersion: networking.istio.io/v1beta1
kind: DestinationRule
metadata:
  name: kiali
  namespace: istio-system
spec:
  host: kiali
  trafficPolicy:
    tls:
      mode: DISABLE
---
apiVersion: networking.istio.io/v1beta1
kind: Gateway
metadata:
  name: kiali-gateway
  namespace: istio-system
spec:
  selector:
    app: istio-ingressgateway
  servers:
  - port:
      number: 20001
      name: http-kiali
      protocol: HTTP
    hosts:
    - "kiali.magedu.com"
---
apiVersion: networking.istio.io/v1beta1
kind: VirtualService
metadata:
  name: kiali-virtualservice
  namespace: istio-system
spec:
  hosts:
  - "kiali.magedu.com"
  gateways:
  - kiali-gateway
  http:
  - match:
    - port: 20001
    route:
    - destination:
        host: kiali
        port:
          number: 20001
---
rate(istio_requests_total{app="demoapp"}[1m])
rate(istio_requests_total{app="proxy"}[1m])
使用IstioOperator配置服务级指标
root@master003:/opt/istio-in-practise/Observability/Service-Level# cat istio-operator-new-dimesions.yaml
apiVersion: install.istio.io/v1alpha1
kind: IstioOperator
spec:
  profile: demo
  values:
    telemetry:
      v2:
        prometheus:
          configOverride:
            inboundSidecar:
              metrics:
                - name: requests_total
                  dimensions:
                    request_host: request.host
                    request_method: request.method
                  tags_to_remove:
                  - request_protocol
            outboundSidecar:
              metrics:
                - name: requests_total
                  dimensions:
                    request_host: request.host
                    request_method: request.method
                  tags_to_remove:
                  - request_protocol
            gateway:
              metrics:
                - name: requests_total
                  dimensions:
                    request_host: request.host
                    request_method: request.method
                  tags_to_remove:
                  - request_protocol
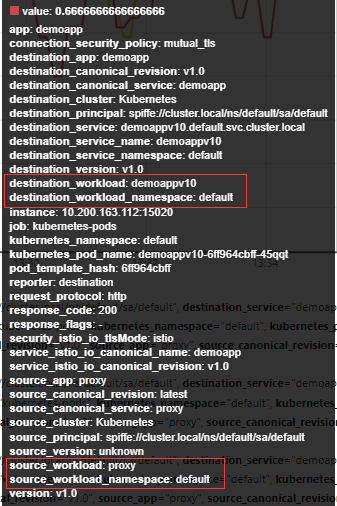
服务级指标上默认使用的标签
Istio默认提供的服务级指标上使用的标签
Reporter:该指标reporter的身份标识
reporter是服务端Sidecar Envoy时,其值为destination;
reporter是客户端Sidecar Envoy或Ingress Gateway时,其值为source;
Source Workload:源工作负载的标识,缺少相关信息时,则标识为unknown;
Source Workload Namespace:源工作负载所在名称空间,缺少相关信息时,则标识为unknown;
Source Principal:源工作负载的身份标识,通常为相关工作负载的SPIFFIE ID;
Source App:源应用程序名称,其值为相应工作负载上app标签的值,缺少相关信息时标识为unknown;
Source Version:源应用程序版本,其值为相应工作负载上version标签的值,缺少相关信息时标识为unknown;
Destination Workload:目标工作负载的标识,缺少相关信息时,则标识为unknown;
Destination Workload Namespace:目标工作负载所在名称空间,缺少相关信息时,则标识为unknown;
Destination Principal:目标工作负载的身份标识,通常为相关工作负载的SPIFFIE ID;
Destination App:目标应用程序名称,其值为相应工作负载上app标签的值;
Destination Version:源应用程序版本,其值为相应工作负载上version标签的值,缺少相关信息时标识为unknown;
Destination Service:请求报文中的目标服务(即目标主机),例如demoapp.default.svc.cluster.local;
3.3 配置服务级指标
配置服务级指标时,各指标的标签值通常要引用自连接的属性(attribute)信息,开箱可用的有
由metadata-exchange扩展提供的tcp连接的有关属性
HTTP请求属性
Envoy在连接上支持使用的各类属性
TCP连接相关属性
属性 简要说明
name Pod名称
namespace Pod所在的名称空间
labels 工作负载的标签
owner 工作负载的owner
workload_name 工作负载名称
platform_metadata 使用特定键前缀的平台元数据
istio_version Istio版本
mesh_id 网格标识
cluster_id 工作负载所在集群的标识
app_containers 应用容器的短格式名称列表
Http连接相关属性
属性 简要说明
request.path URL中的Path
request.url_path 不包含查询参数的URL Path
request.host URL中的host
request.scheme URL中的协议
request.method 请求方法
request.headers 请求报文中的所有标头(小写格式)
request.referer Referer标头
request.useragent User-Agent标头
request.time 接收到第一个字节的时间
request.id x-request-id标头中的请求标识
request.protocol 请求协议
3.4 配置服务级指标(全局配置)
修改现有指标上的标签示例
在requests_total指标之上新增两个标签
destination_port
request_host
在requests_total移除一个标签
request_protocol
验证
运行命令,查看EnvoyFilter资源的变动
kubectl get envoyfilters stats-filter-1.12 -o yaml -n istio-system
在Envoy的bootstrap中注入,因此,
仅对新创建的Pod有效
注意:以上为网格全局化的变动,
可能会导致后端指标服务过载
使用Telemetry CR完成 配置服务级指标
root@slave002:/opt/istio/istio-in-practise/Observability/Service-Level# cat namespace-metrics.yaml
apiVersion: telemetry.istio.io/v1alpha1
kind: Telemetry
metadata:
  name: namespace-metrics
  namespace: default   #名称空间pod中
spec:
  # no selector specified, applies to all workloads in the namespace
  metrics:
  - providers:
    - name: prometheus
    overrides:
    # match clause left off matches all istio metrics, client and server
    - tagOverrides:
        request_method:
          value: "request.method"  #添加两个特定的指标
        request_host:
          value: "request.host"
root@slave002:/opt/istio/istio-in-practise/Observability/Service-Level# cat deploy-demoapp.yaml
---
apiVersion: apps/v1
kind: Deployment
metadata:
  labels:
    app: demoappv10
    version: v1.0
  name: demoappv10
spec:
  progressDeadlineSeconds: 600
  replicas: 3
  selector:
    matchLabels:
      app: demoapp
      version: v1.0
  template:
    metadata:
      labels:
        app: demoapp
        version: v1.0
      annotations:
        sidecar.istio.io/extraStatTags: request_method, request_host  #在特定的工作负载指定
    spec:
      containers:
      - image: ikubernetes/demoapp:v1.0
        imagePullPolicy: IfNotPresent
        name: demoapp
        env:
        - name: "PORT"
          value: "8080"
        ports:
        - containerPort: 8080
          name: web
          protocol: TCP
        resources:
          limits:
            cpu: 50m
---
控制平面指标数据
root@slave001:~# curl 10.100.136.217:15014/metrics
root@master003:/opt/istio-in-practise/Traffic-Management-Basics# cat grafana/*
apiVersion: networking.istio.io/v1beta1
kind: DestinationRule
metadata:
  name: grafana
  namespace: istio-system
spec:
  host: grafana
  trafficPolicy:
    tls:
      mode: DISABLE
---
apiVersion: networking.istio.io/v1beta1
kind: Gateway
metadata:
  name: grafana-gateway
  namespace: istio-system
spec:
  selector:
    app: istio-ingressgateway
  servers:
  - port:
      number: 80
      name: http
      protocol: HTTP
    hosts:
    - "grafana.magedu.com"
---
apiVersion: networking.istio.io/v1beta1
kind: VirtualService
metadata:
  name: grafana-virtualservice
  namespace: istio-system
spec:
  hosts:
  - "grafana.magedu.com"
  gateways:
  - grafana-gateway
  http:
  - match:
    - uri:
        prefix: /
    route:
    - destination:
        host: grafana
        port:
          number: 3000
---
grafana配置数据源
http://prometheus:9090
导入模板 7645
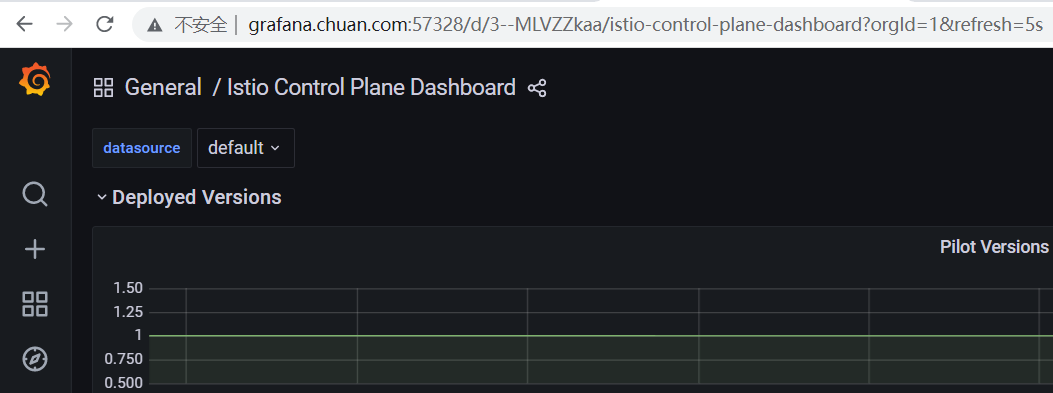
7636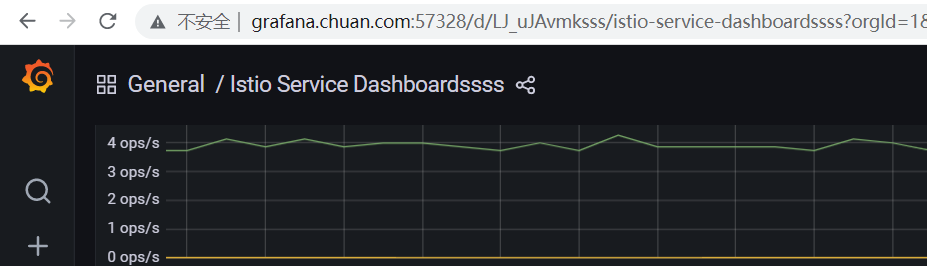
访问网格访问日志
root@master003:/opt/istio-in-practise/Traffic-Management-Basics# cat tracing/*
apiVersion: networking.istio.io/v1beta1
kind: DestinationRule
metadata:
  name: tracing-dr
  namespace: istio-system
spec:
  host: tracing
  trafficPolicy:
    tls:
      mode: DISABLE
---
apiVersion: networking.istio.io/v1beta1
kind: Gateway
metadata:
  name: tracing-gateway
  namespace: istio-system
spec:
  selector:
    app: istio-ingressgateway
  servers:
  - port:
      number: 80
      name: http
      protocol: HTTP
    hosts:
    - "tracing.magedu.com"
---
apiVersion: networking.istio.io/v1beta1
kind: VirtualService
metadata:
  name: tracing-virtualservice
  namespace: istio-system
spec:
  hosts:
  - "tracing.magedu.com"
  gateways:
  - tracing-gateway
  http:
  - match:
    - uri:
        prefix: /
    route:
    - destination:
        host: tracing
        port:
          number: 80
---

 浙公网安备 33010602011771号