
Python高级应用程序设计任务
一、主题式网络爬虫设计方案(15分)
1.主题式网络爬虫名称
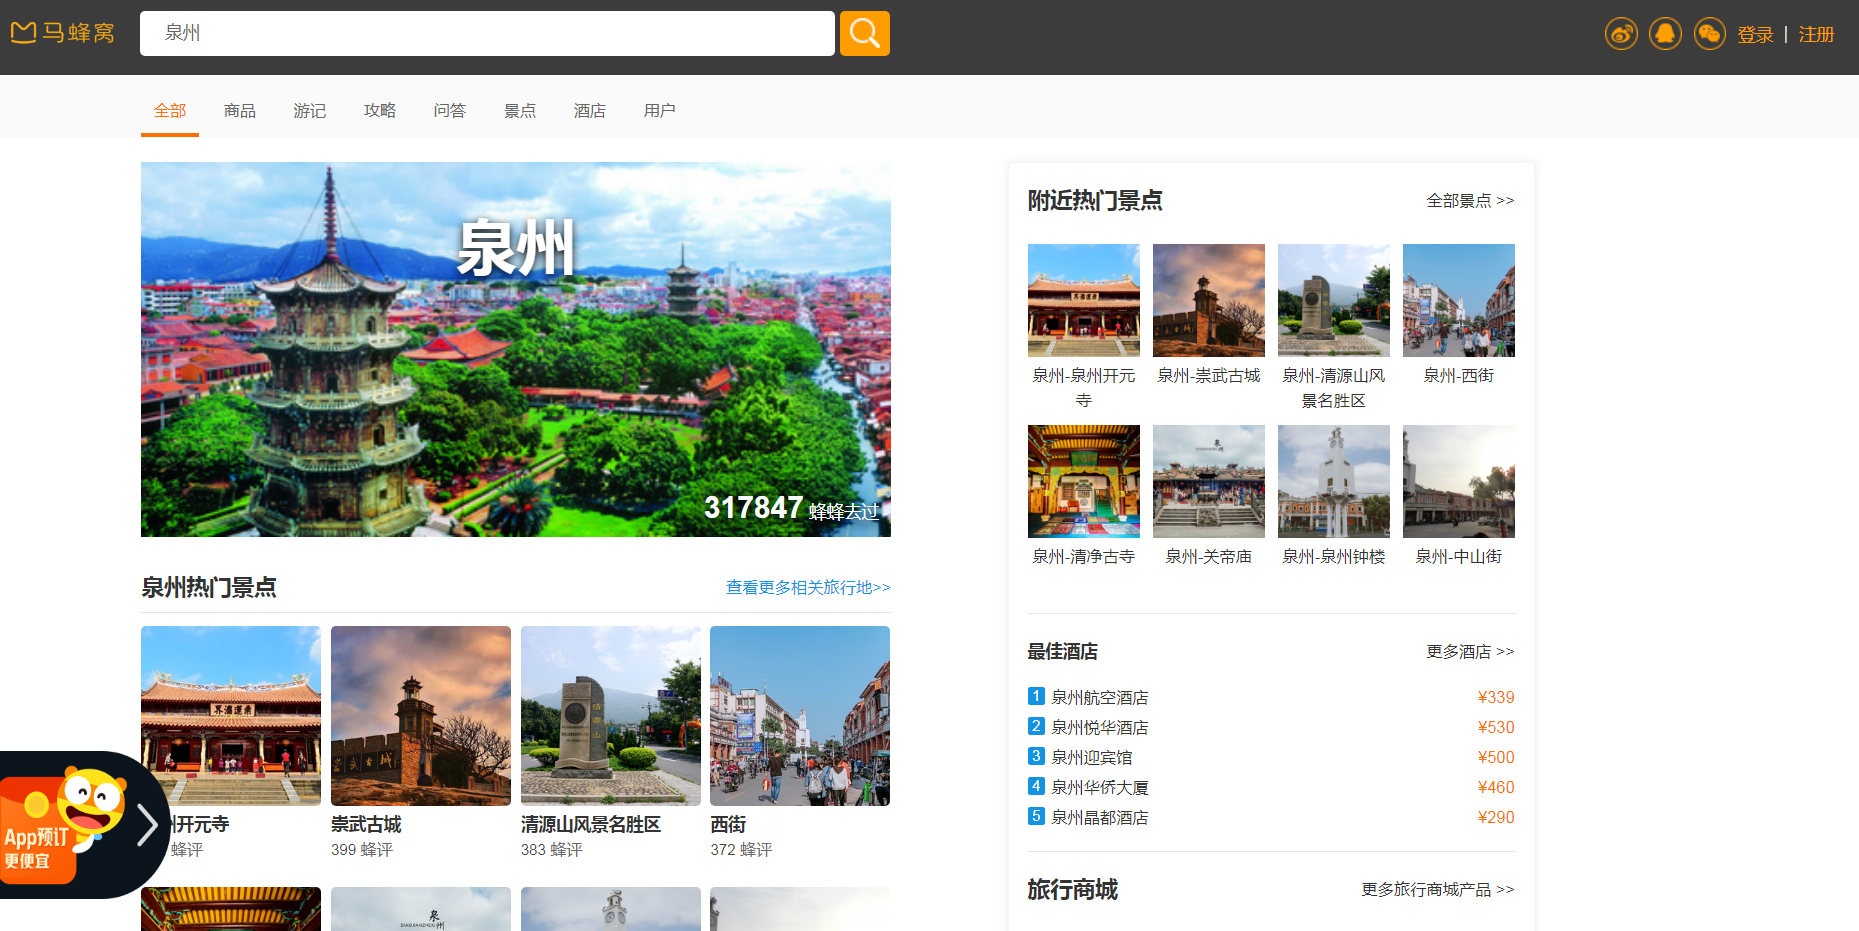
名称:爬取马蜂窝泉州景点数据信息
2.主题式网络爬虫爬取的内容与数据特征分析本次爬虫主要爬取马蜂窝在泉州地区的景点票价和游玩地点信息
3.主题式网络爬虫设计方案概述(包括实现思路与技术难点)本次设计方案主要使用request库和beautifulSoup库对网站访问,最后将数据以表格的形式输出。
技术难点主要包括对马蜂窝页面的采集和数据清洗。
二、主题页面的结构特征分析(15分)
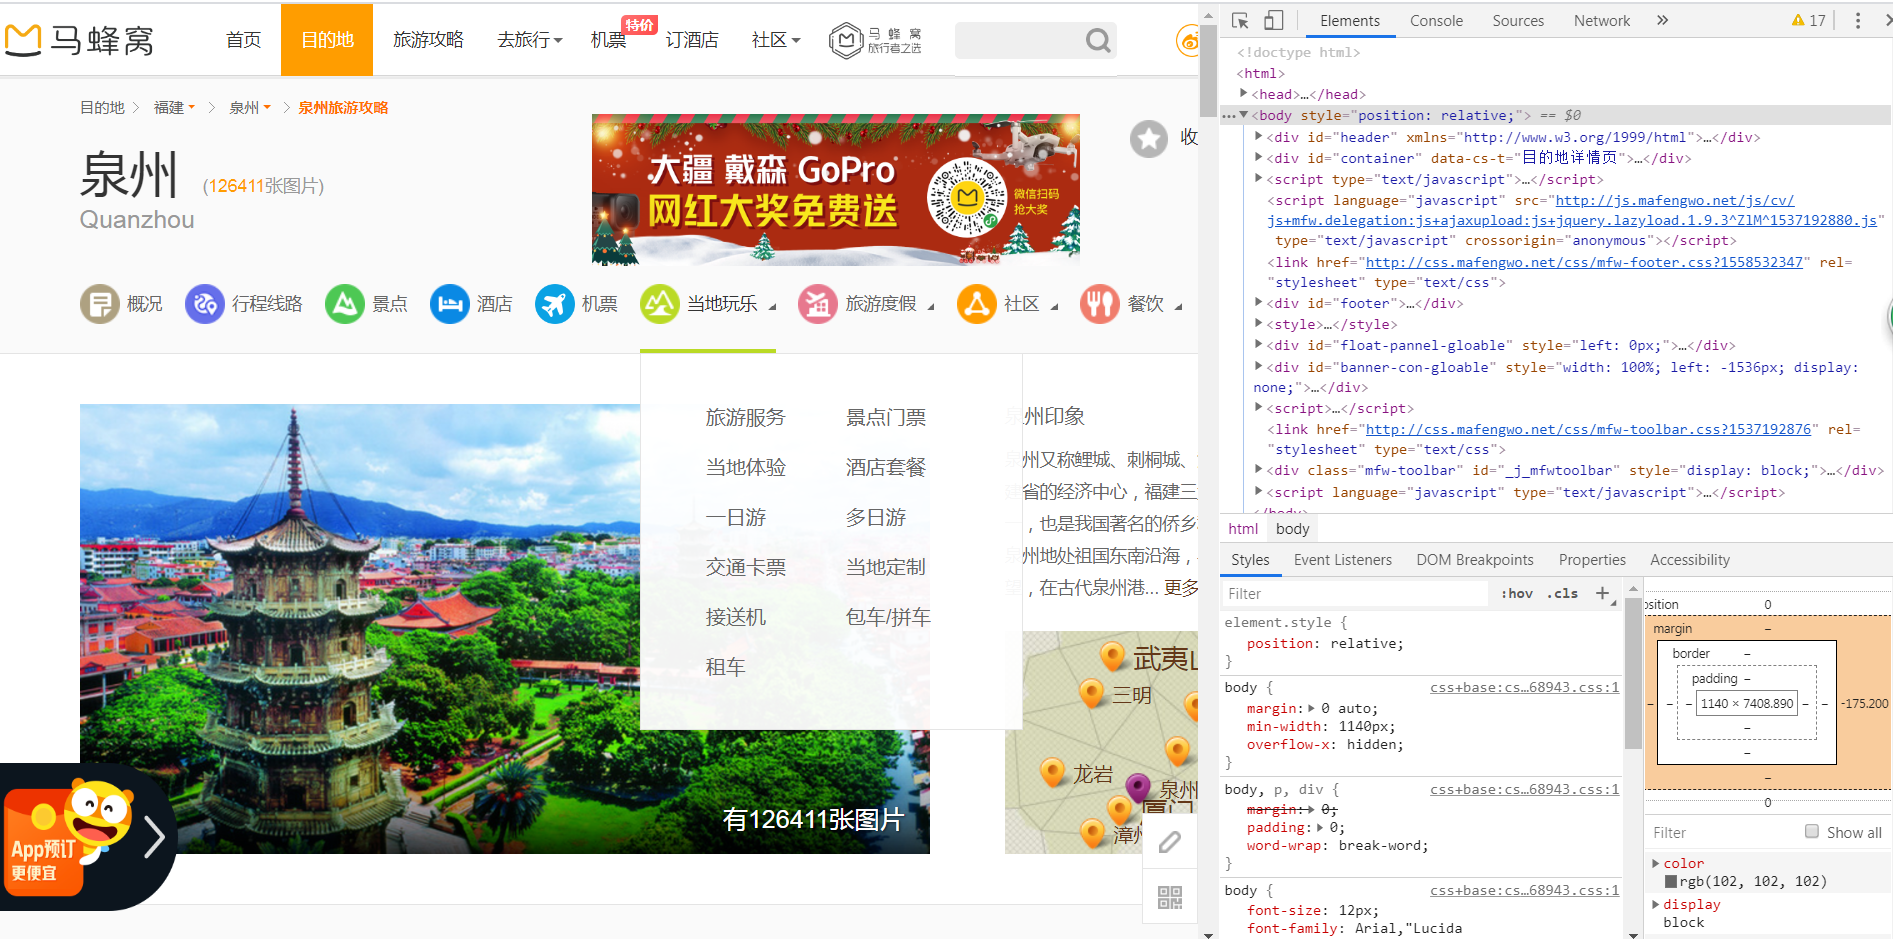
1.主题页面的结构特征
1.主题页面的结构特征
2.Htmls页面解析
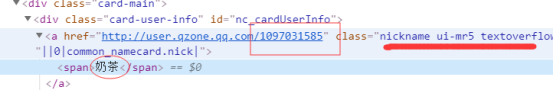
3.节点(标签)查找方法与遍历方法
(必要时画出节点树结构)
查找用find函数,遍历用for循环。
查找用find函数,遍历用for循环。
三、网络爬虫程序设计(60分)
爬虫程序主体要包括以下各部分,要附源代码及较详细注释,并在每部分程序后面提供输出结果的截图。
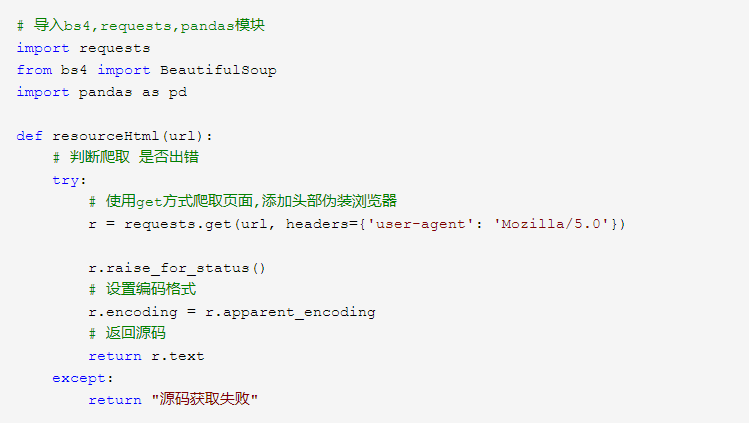
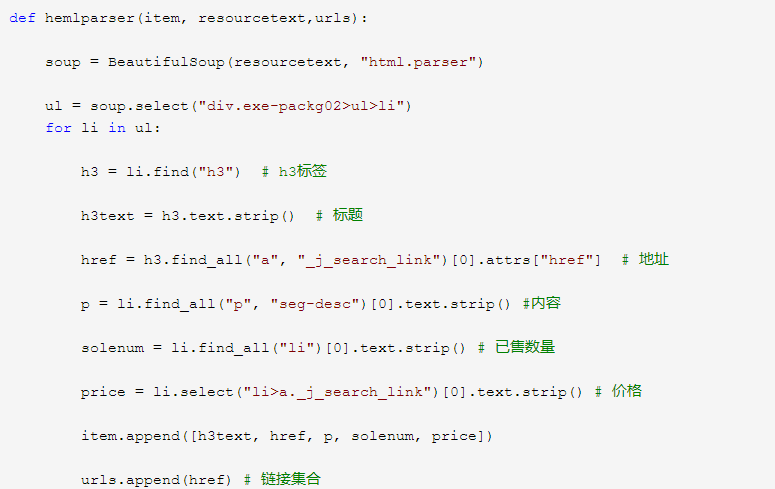
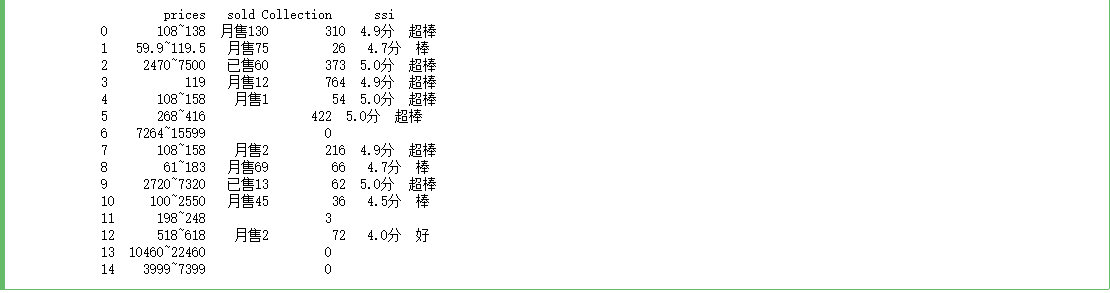
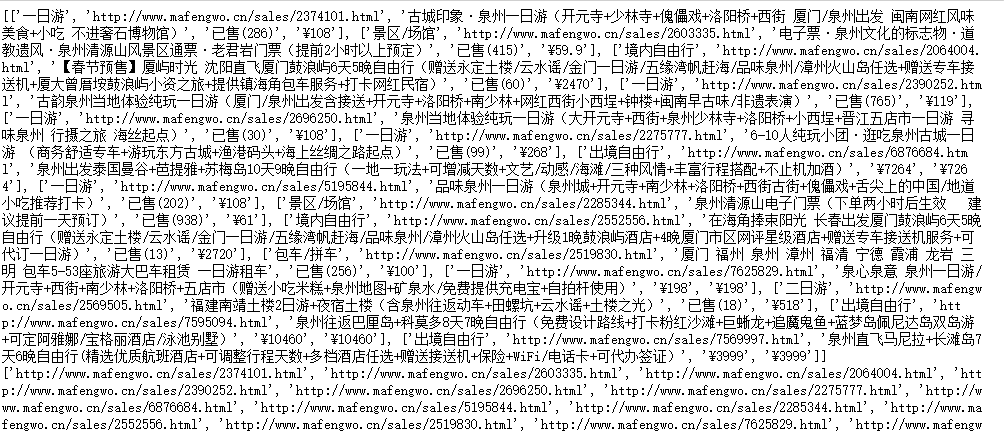
1.数据爬取与采集
2.对数据进行清洗和处理
3.文本分析(可选):jieba分词、wordcloud可视化
4.数据分析与可视化
(例如:数据柱形图、直方图、散点图、盒图、分布图、数据回归分析等)
(例如:数据柱形图、直方图、散点图、盒图、分布图、数据回归分析等)
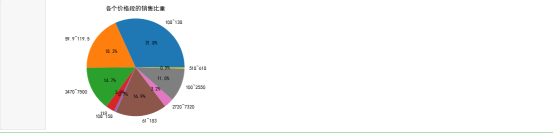
import matplotlib.pyplot as plt

plt.rcParams['font.sans-serif']=['SimHei'] #用来正常显示中文标签
plt.rcParams['axes.unicode_minus']=False #用来正常显示负号

Type = ['108~138', '59.9~119.5', '2470~7500','119', '108~158','61~183','2720~7320','100~2550','518~618']
Data = [130, 75, 60, 12,3,69,13,45,2]
#cols = ['r','g','y','coral']
#绘制饼图
plt.pie(Data ,labels=Type, autopct='%1.1f%%')
#设置显示图像为圆形
plt.axis('equal')
plt.title('各个价格段的销售比重')
plt.show()
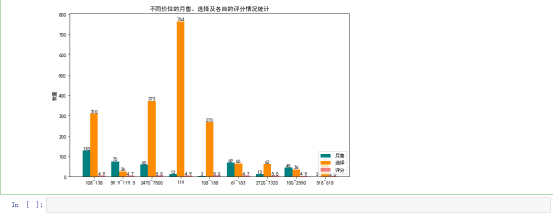
import matplotlib.pyplot as plt
plt.rcParams['font.family'] = ['sans-serif']
plt.rcParams['font.sans-serif'] = ['SimHei']

plt.figure(figsize=(10,6))
# 价格
prices = ['108~138', '59.9~119.5', '2470~7500','119', '108~158','61~183','2720~7320','100~2550','518~618']
# 月售,选择,评分
undergraduate_enrollment = [130, 75, 60, 12,3,69,13,45,2]
secondary_vocational_enrollment = [310, 26,373,764,270,66,62,36,72]
high_school_enrollment = [4.9,4.7,5.0,4.9,5.0,4.7,5.0,4.5,4.0]
x = list(range(len(undergraduate_enrollment)))

#设置间距
total_width, n = 0.8, 3
width = total_width / n
#在偏移间距位置绘制柱状图1
for i in range(len(x)):
    x[i] -= width
plt.bar(x, undergraduate_enrollment, width=width, label='月售', fc='teal')
# 设置数字标签
for a, b in zip(x, undergraduate_enrollment):
    plt.text(a, b, b, ha='center', va='bottom', fontsize=10)

#在偏移间距位置绘制柱状图2
for i in range(len(x)):
    x[i] += width
plt.bar(x, secondary_vocational_enrollment, width=width, label='选择', tick_label=prices, fc='darkorange')
# 设置数字标签
for a, b in zip(x, secondary_vocational_enrollment):
    plt.text(a, b, b, ha='center', va='bottom', fontsize=10)

#在偏移间距位置绘制柱状图3
for i in range(len(x)):
    x[i] += width
plt.bar(x, high_school_enrollment, width=width, label='评分', fc='lightcoral')
# 设置数字标签
for a, b in zip(x, high_school_enrollment):
    plt.text(a, b, b, ha='center', va='bottom', fontsize=10)

plt.title("不同价位的月售、选择及各自的评分情况统计")
plt.ylabel("数量")
plt.legend(loc='lower right')

plt.show()
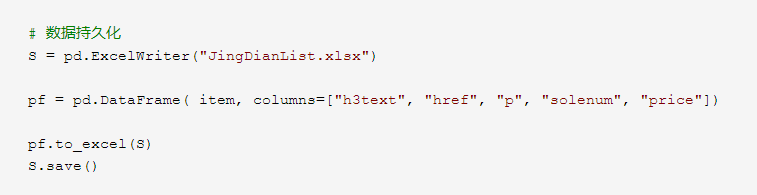
5.数据持久化
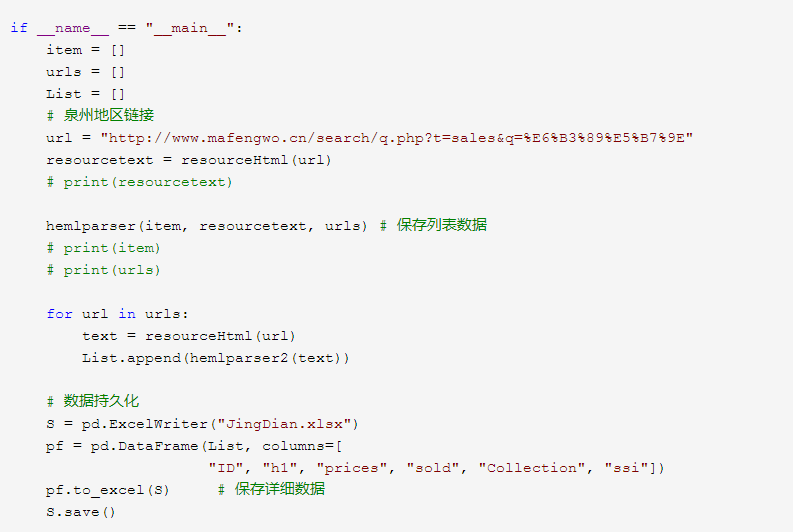
6.附完整程序代码
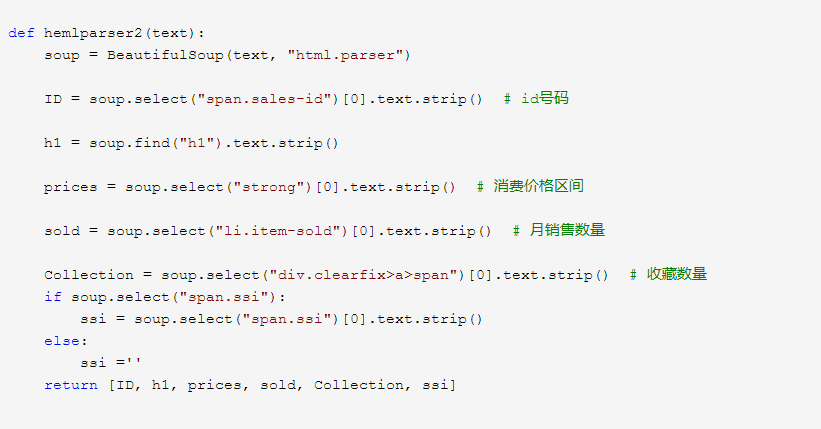
# 导入bs4,requests,pandas模块
import requests
from bs4 import BeautifulSoup
import pandas as pd

def resourceHtml(url):
    # 判断爬取 是否出错
    try:
        # 使用get方式爬取页面,添加头部伪装浏览器
        r = requests.get(url, headers={'user-agent': 'Mozilla/5.0'})

        r.raise_for_status()
        # 设置编码格式
        r.encoding = r.apparent_encoding
        # 返回源码
        return r.text
    except:
        return "源码获取失败"


def hemlparser(item, resourcetext,urls):

    soup = BeautifulSoup(resourcetext, "html.parser")

    ul = soup.select("div.exe-packg02>ul>li")
    for li in ul:

        h3 = li.find("h3")  # h3标签

        h3text = h3.text.strip()  # 标题

        href = h3.find_all("a", "_j_search_link")[0].attrs["href"]  # 地址

        p = li.find_all("p", "seg-desc")[0].text.strip() #内容

        solenum = li.find_all("li")[0].text.strip() # 已售数量

        price = li.select("li>a._j_search_link")[0].text.strip() # 价格

        item.append([h3text, href, p, solenum, price])

        urls.append(href) # 链接集合

    # 数据持久化
    S = pd.ExcelWriter("JingDianList.xlsx")

    pf = pd.DataFrame( item, columns=["h3text", "href", "p", "solenum", "price"])

    pf.to_excel(S)
    S.save()


def hemlparser2(text):
    soup = BeautifulSoup(text, "html.parser")

    ID = soup.select("span.sales-id")[0].text.strip()  # id号码

    h1 = soup.find("h1").text.strip()

    prices = soup.select("strong")[0].text.strip()  # 消费价格区间

    sold = soup.select("li.item-sold")[0].text.strip()  # 月销售数量

    Collection = soup.select("div.clearfix>a>span")[0].text.strip()  # 收藏数量
    if soup.select("span.ssi"):
        ssi = soup.select("span.ssi")[0].text.strip()
    else:
        ssi =''
    return [ID, h1, prices, sold, Collection, ssi]


if __name__ == "__main__":
    item = []
    urls = []
    List = []
    # 泉州地区链接
    url = "http://www.mafengwo.cn/search/q.php?t=sales&q=%E6%B3%89%E5%B7%9E"
    resourcetext = resourceHtml(url)
    # print(resourcetext)

    hemlparser(item, resourcetext, urls) # 保存列表数据
    # print(item)
    # print(urls)

    for url in urls:
        text = resourceHtml(url)
        List.append(hemlparser2(text))

    # 数据持久化
    S = pd.ExcelWriter("JingDian.xlsx")
    pf = pd.DataFrame(List, columns=[
                      "ID", "h1", "prices", "sold", "Collection", "ssi"])
    pf.to_excel(S)     # 保存详细数据
    S.save()
四、结论(10分)
1.经过对主题数据的分析与可视化,可以得到哪些结论?
1.经过对主题数据的分析与可视化,可以得到哪些结论?
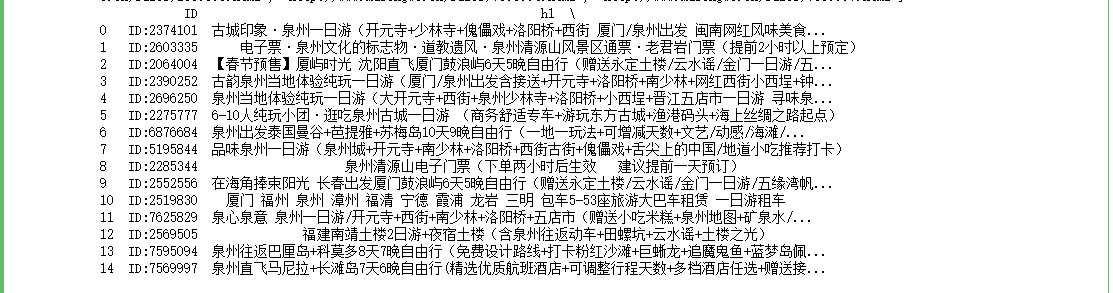
通过马蜂窝泉州景点的数据分析和可视化,可以发现景点选择票价在108到138的占比最大,而59到110多的人反而才占第二,令人惊讶的是2千到7千的占百分之14,说明大多数人都是来玩几天的,而非短暂的旅行,而消费高的评分往往也不低。
2.对本次程序设计任务完成的情况做一个简单的小结。
通过这次对马蜂窝景点数据信息的爬取,我明确意识到自己还有极大的知识缺漏,在学习过程中,我求助同学,上网查找资料,及时解决问题,先理清思路,清楚自己到底做什么,下一步应该如何,循序渐进,虽然代码非常粗糙,但是我对python的知识又更进了一步,我会继续学习的。

 浙公网安备 33010602011771号