use matplotlib to draw scatter plot
There are many pionts in this kind of table.
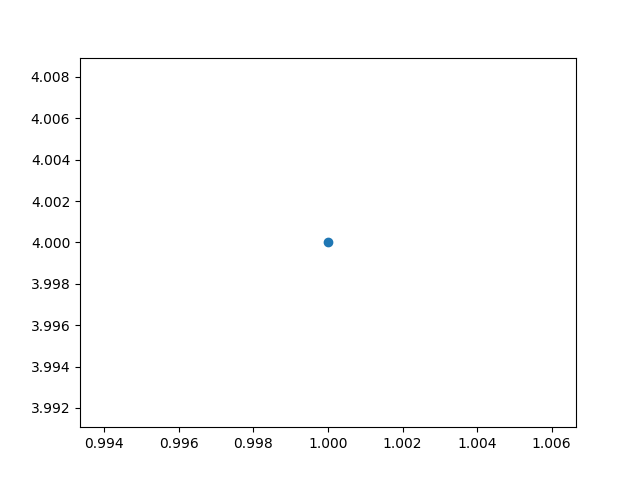
How to do it? We can use scatter() to draw it.
Code:
import matplotlib.pyplot as plt
plt.scatter(1,4)
plt.show()
The result :
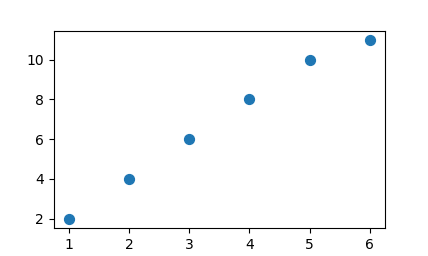
now,we can use scatter() to draw many pionts.Just like this:
code:
import matplotlib.pyplot as plt
x=[1,2,3,4,5,6]
y=[2,4,6,8,10,11]
plt.scatter(x,y,s=50)
plt.show()
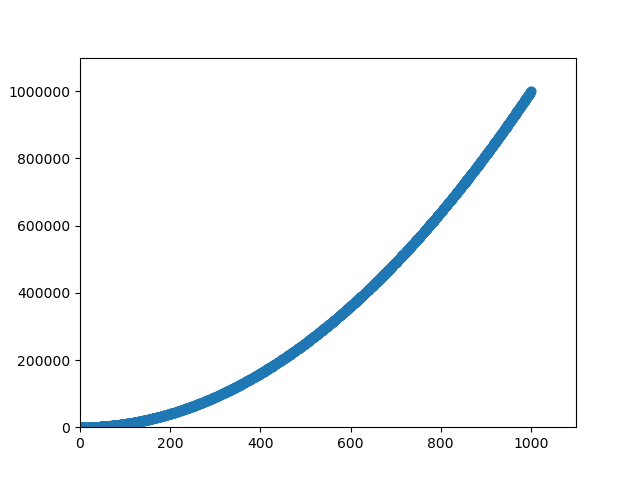
现在试试绘制更多的点,代码如下:
import matplotlib.pyplot as plt
x_values=list(range(1,1001))
y_valuse=[x**2 for x in x_values]
plt.scatter(x_values,y_valuse,s=40)
plt.axis([0,1100,0,1100000])#参数从左向右含义一次是:横坐标的起始点、横坐标的最大值,纵坐标的起始点,纵坐标的最大值
plt.show()
绘制效果如下图所示: