Python网络爬虫—对小说网站的爬取以及简易可视化分析
(一)选题背景:
以下是电子书与纸质书的基本区别
1. 便携性:电子书可以在电子设备上存储和阅读,便于携带和阅读;纸质书则需要占用更多的空间和重量,不太方便携带。因此,对于需要频繁出差或旅行的人来说,电子书可能更受欢迎。
2. 阅读体验:纸质书的纸张质感和印刷质量可以提供更好的阅读体验,而电子书则可能会受到屏幕反光、眼睛疲劳等问题的影响。因此,对于注重阅读体验的人来说,纸质书可能更受欢迎。
3. 价格:电子书通常比纸质书价格更便宜,因为它们不需要印刷和运输等成本。因此,对于注重价格的人来说,电子书可能更受欢迎。
4. 环保性:电子书不需要纸张和印刷,因此对环境的影响更小,更符合环保意识。因此,对于注重环保的人来说,电子书可能更受欢迎。
电子书多样所以想做一个简单的可视化分析帮助书荒友快速进行选择
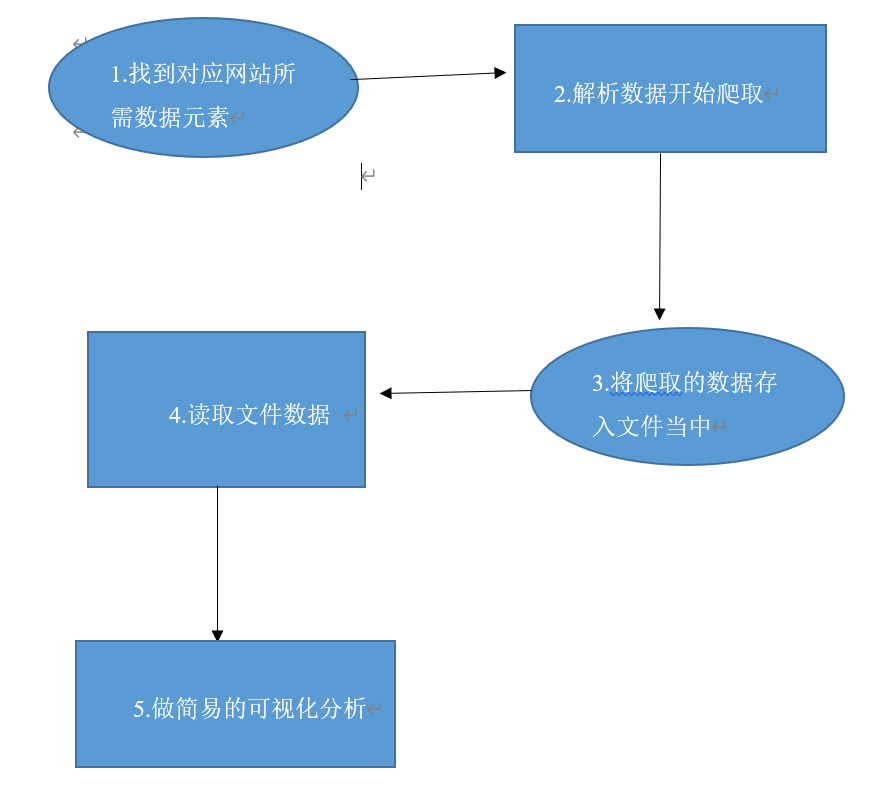
(二)简易步骤解释
1.爬取网站数据 网站:https://www.hongxiu.com/
2.对目标页面 F12进入开发者模式 开始检查 并找到对应元素

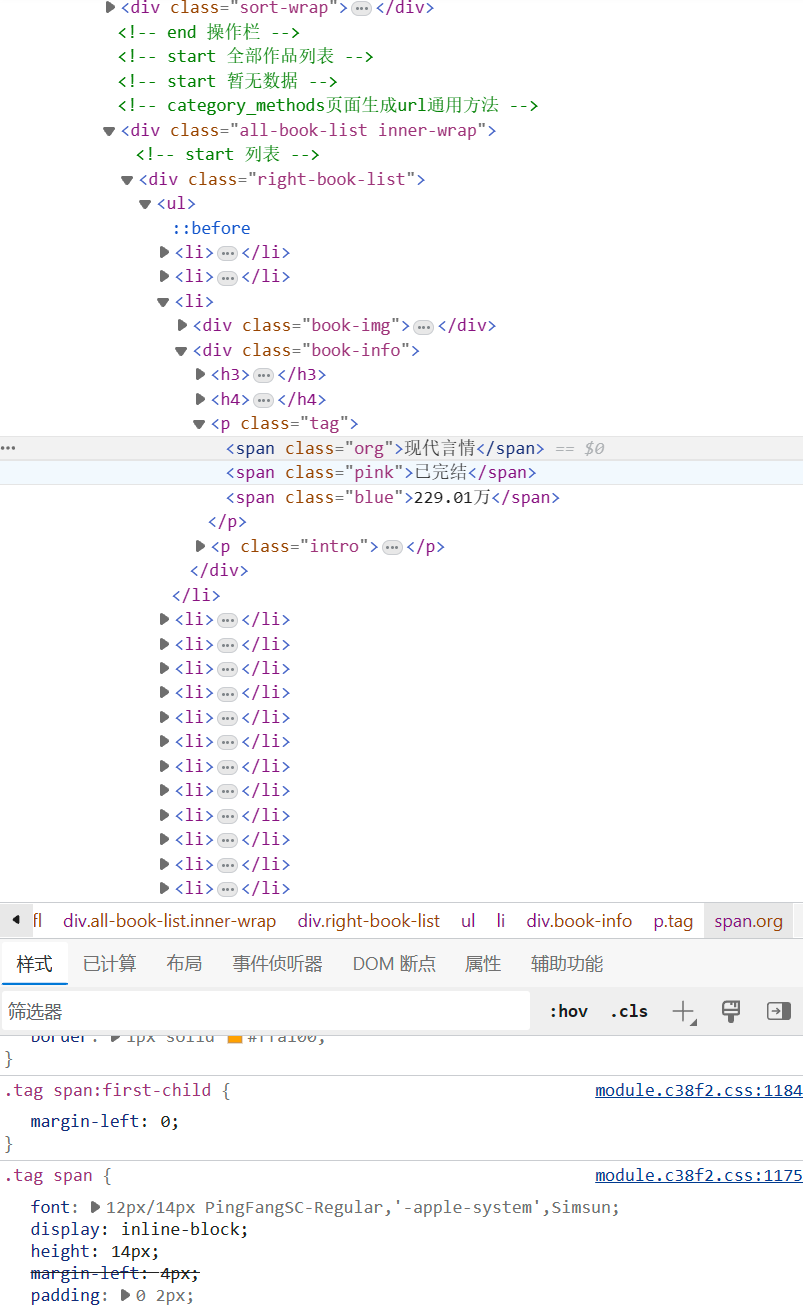

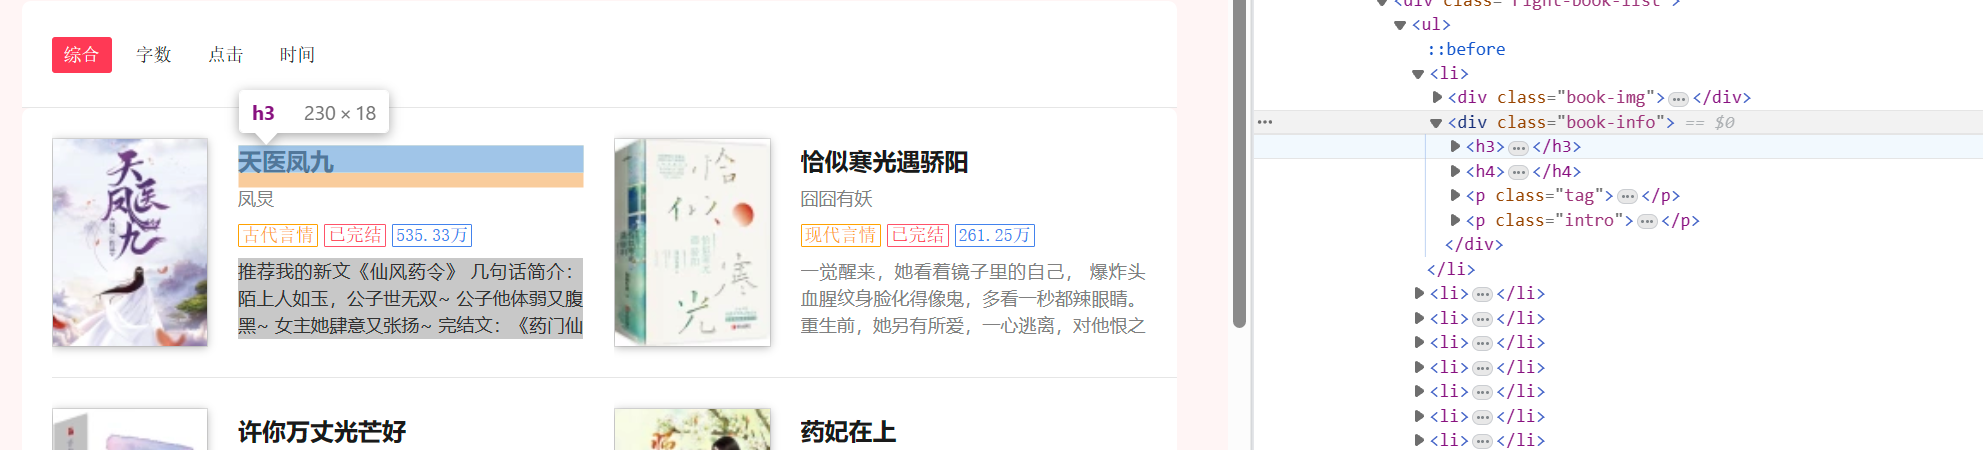
爬取的内容:总共50页 我们选择爬取40页 每页20条 共800条数据
可以看出我们可以从名称 作者 类型 是否完结 人气 以及简介来完成此次分析
此次程序用到的库有:requests、beautifulSoup、pyecharts等
过程图
2.对数据进行分析
三.具体步骤
1.对网站爬取并存储到文件中
准备好收集数据所需要的库,利用anaconda pip可快速安装所需要的库

1   import requests
2   from bs4 import BeautifulSoup
3   from openpyxl import Workbook
根据观察每一页的页面的网址变化 由于我们需要爬取40页的数据网络
1  base_url = 'https://www.hongxiu.com/category/f1_f1_f1_f1_f1_f1_0_'
2  page_count = 40  # 爬取的总页数
 1 import requests
 2 from bs4 import BeautifulSoup
 3 from openpyxl import Workbook
 4
 5 base_url = 'https://www.hongxiu.com/category/f1_f1_f1_f1_f1_f1_0_'
 6 page_count = 40  # 爬取的总页数
 7
 8 # 创建Excel
 9 workbook = Workbook()
10 sheet = workbook.active
11
12 # 设置表头
13 sheet['A1'] = '名称'
14 sheet['B1'] = '作者'
15 sheet['C1'] = '类型'
16 sheet['D1'] = '是否完结'
17 sheet['E1'] = '人气'
18 sheet['F1'] = '简介'
19
20 row = 2  # 从第二行开始写入数据
21
22 # 循环遍历每一页
23 for page in range(1, page_count + 1):
24     url = base_url + str(page)
25
26     # 发送HTTP请求获取页面内容
27     response = requests.get(url)
28     content = response.text
29
30     # 使用BeautifulSoup解析HTML内容
31     soup = BeautifulSoup(content, 'html.parser')
32
33     # 找到小说列表所在的HTML元素
34     novel_list = soup.find_all('div', class_='book-info')
35
36     # 遍历小说列表,提取所需信息
37     for novel in novel_list:
38         # 提取小说名称
39         name = novel.find('h3').a.text.strip()
40
41         # 提取作者
42         author = novel.find('h4').a.text.strip()
43
44         # 提取类型
45         category = novel.find('span', class_='org').text.strip()
46
47         # 提取是否完结
48         is_complete = novel.find('span', class_='pink').text.strip()
49
50         # 提取人气
51         popularity = novel.find('span', class_='blue').text.strip()
52
53         # 提取简介
54         intro = novel.find('p', class_='intro').text.strip()
55
56         # 将提取的数据写入Excel
57         sheet['A' + str(row)] = name
58         sheet['B' + str(row)] = author
59         sheet['C' + str(row)] = category
60         sheet['D' + str(row)] = is_complete
61         sheet['E' + str(row)] = popularity
62         sheet['F' + str(row)] = intro
63
64         row += 1
65
66 # 保存Excel文件
67 file_path = 'D:\gui\gui work.xlsx'
68 workbook.save(file_path)
69
70 print('数据已成功保存到Excel文件:', file_path)
打开位置D:\gui\gui work.xlsx 的文件 文件截图以下所示
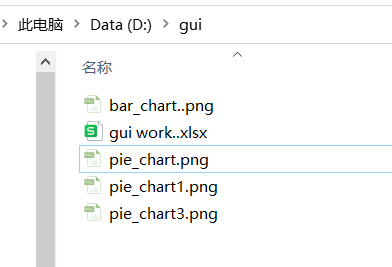

如图展示
1.读取文件数据
1   # 读取Excel文件中的数据
2   file_path = 'D:\gui\gui work.xlsx'
3  df = pd.read_excel(file_path)
2.对所得的数据利用pyecharts饼图进行分析
 1 import pandas as pd
 2 from pyecharts import options as opts
 3 from pyecharts.charts import Pie
 4
 5 # 读取Excel文件中的数据
 6 file_path = 'D:\gui\gui work.xlsx'
 7 df = pd.read_excel(file_path)
 8
 9 # 统计不同类型小说的数量
10 category_counts = df['类型'].value_counts()
11
12 # 创建饼图
13 pie = (
14     Pie()
15     .add(
16         '',
17         [list(z) for z in zip(category_counts.index, category_counts.values)],
18         radius=['40%', '70%']
19     )
20     .set_global_opts(
21         title_opts=opts.TitleOpts(title="小说类型占比"),
22         legend_opts=opts.LegendOpts(orient="vertical", pos_top="15%", pos_left="2%")
23     )
24     .set_series_opts(label_opts=opts.LabelOpts(formatter="{b}: {c}"))
25 )
26
27 # 保存饼图为PNG文件
28 pie.render('D:\gui\pie_chart.html')
29 png_file_path = 'D:\gui\pie_chart.png'
30 pie.render(png_file_path)
31
32 print('饼图已成功保存为PNG文件:', png_file_path)
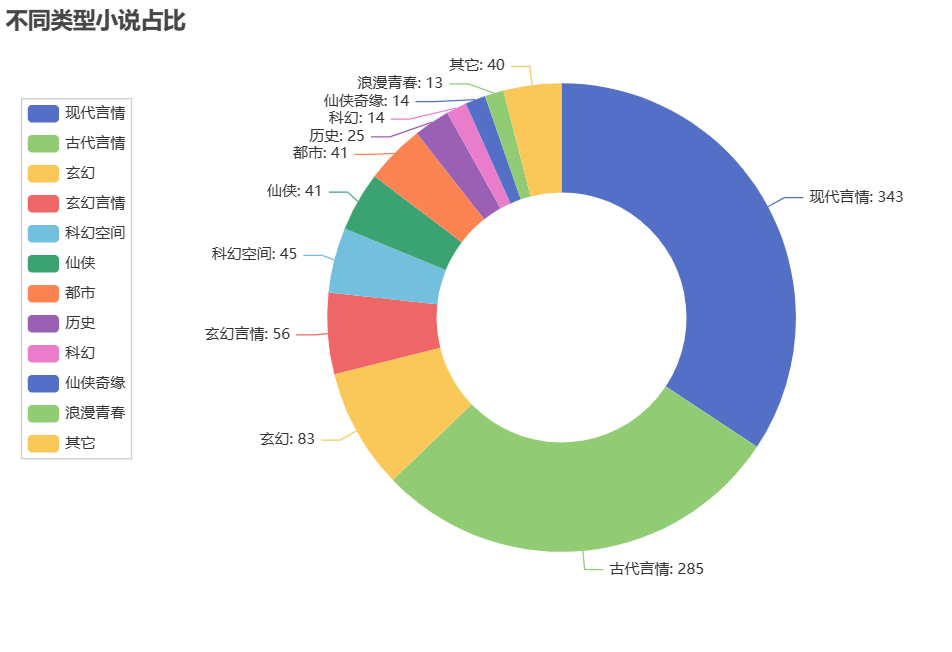
通过此饼图分析可以看出 现代言情占大比
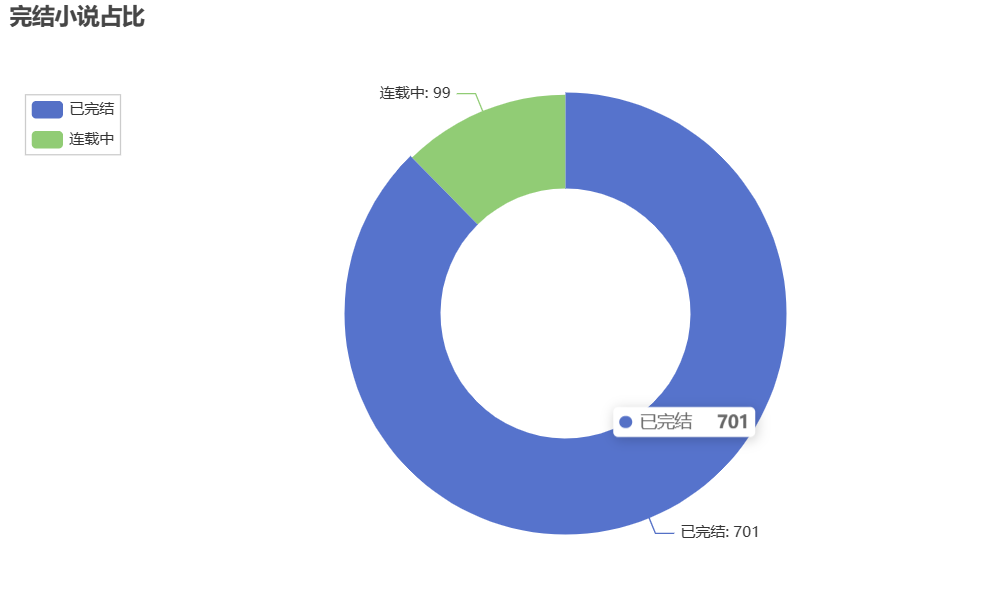
分析完结小说以及未完结小说的占比
 1 import pandas as pd
 2 from pyecharts import options as opts
 3 from pyecharts.charts import Pie
 4
 5 # 读取Excel文件中的数据
 6 file_path = 'D:\gui\gui work.xlsx'
 7 df = pd.read_excel(file_path)
 8
 9 # 统计已完结和连载中小说的数量
10 complete_count = df[df['是否完结'] == '已完结'].shape[0]
11 ongoing_count = df[df['是否完结'] == '连载中'].shape[0]
12
13 # 创建饼图
14 pie = (
15     Pie()
16     .add(
17         '',
18         [('已完结', complete_count), ('连载中', ongoing_count)],
19         radius=['40%', '70%']
20     )
21     .set_global_opts(
22         title_opts=opts.TitleOpts(title="完结小说占比"),
23         legend_opts=opts.LegendOpts(orient="vertical", pos_top="15%", pos_left="2%")
24     )
25     .set_series_opts(label_opts=opts.LabelOpts(formatter="{b}: {c}"))
26 )
27
28 # 保存饼图为PNG文件
29 png_file_path = 'D:\gui\pie_chart1.png'
30 pie.render(png_file_path)
31
32 print('饼图已成功保存为PNG文件:', png_file_path)
利用pyecharts分析小说作家热度 但出现了数据溢出的问题
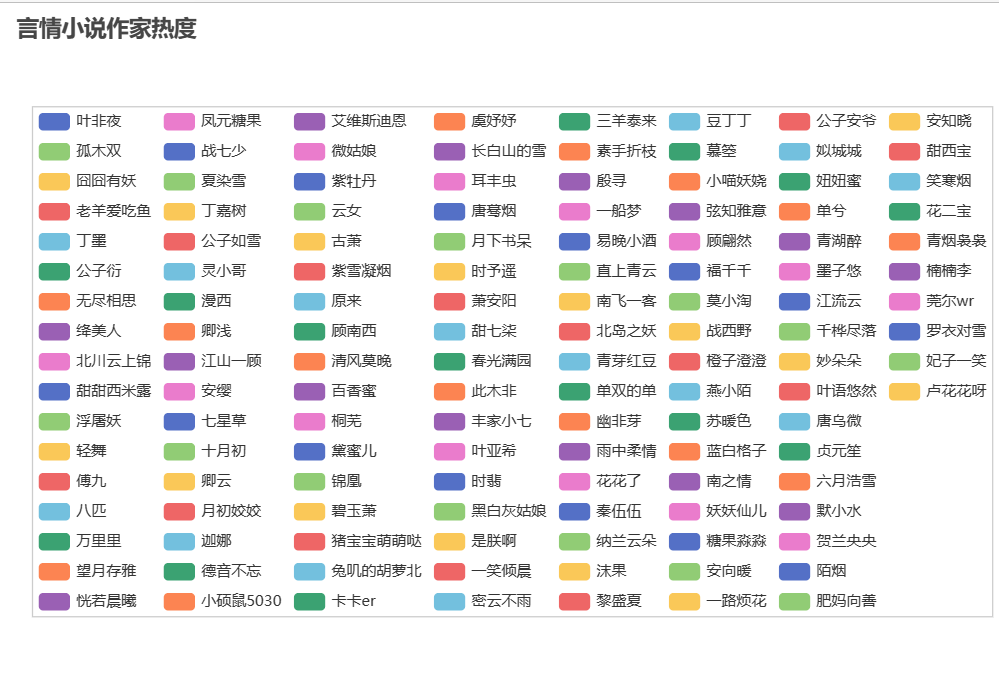
根据作者来统计书本数量 以便我们更快找到优秀作家
 1 import pandas as pd
 2
 3 # 读取Excel文件中的数据
 4 file_path = 'D:\gui\gui work.xlsx'
 5 df = pd.read_excel(file_path)
 6
 7 # 按人气降序排列,并选择前20名
 8 top_20_authors = df['作者'].value_counts().head(20)
 9
10 # 生成排行榜表格
11 rank_table = pd.DataFrame({'作者': top_20_authors.index, '图书数量': top_20_authors.values})
12
13 # 设置排名列
14 rank_table['排名'] = rank_table.index + 1
15
16 # 调整列的顺序
17 rank_table = rank_table[['排名', '作者', '图书数量']]
18
19 # 打印排行榜表格
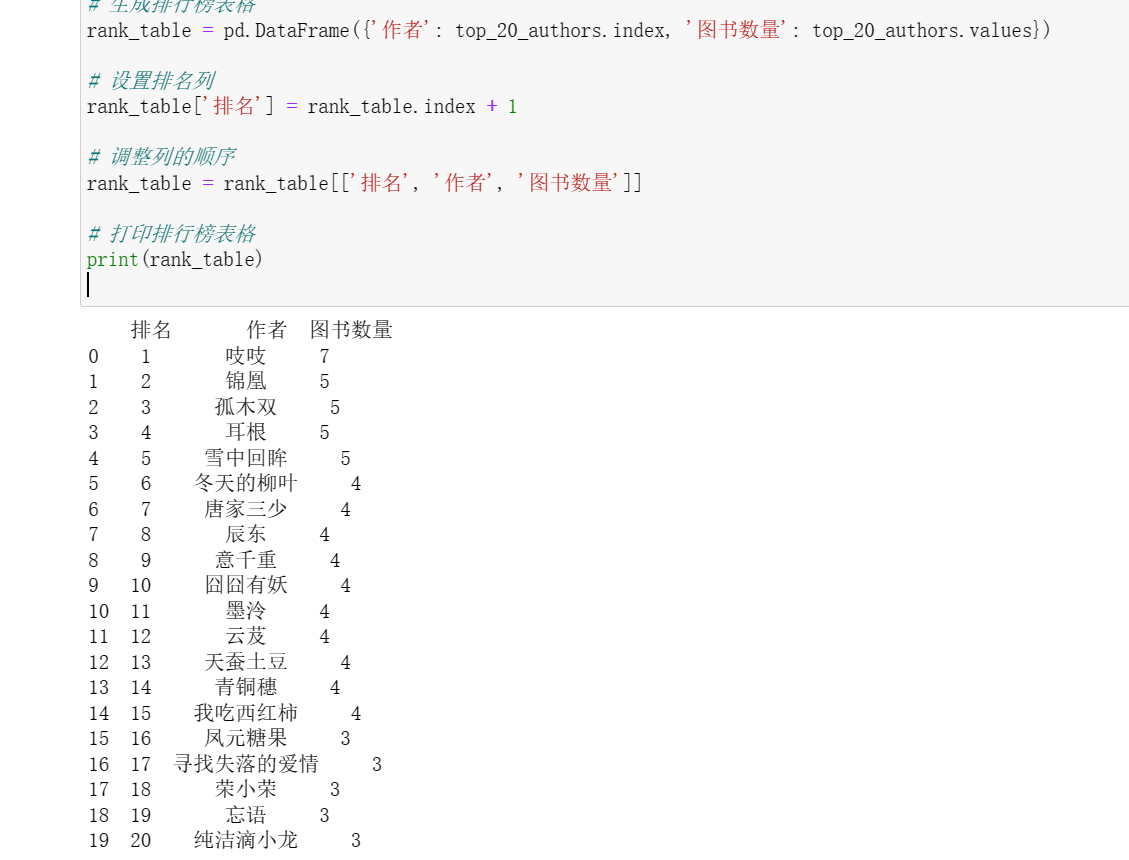
根据人气分析前20名的图书 并用表格表达出来
 1 import pandas as pd
 2
 3 # 读取Excel文件中的数据
 4 file_path = 'D:\gui\gui work.xlsx'
 5 df = pd.read_excel(file_path)
 6
 7 # 按人气降序排列,并选择前20名
 8 top_20_books = df.sort_values(by='人气', ascending=False).head(20)
 9
10 # 设置显示的列名
11 columns = ['图书名称', '作者', '类型', '是否完结', '人气', '简介']
12
13 # 生成表格
14 table = pd.DataFrame(top_20_books, columns=columns)
15
16 # 打印表格
17 print(table)

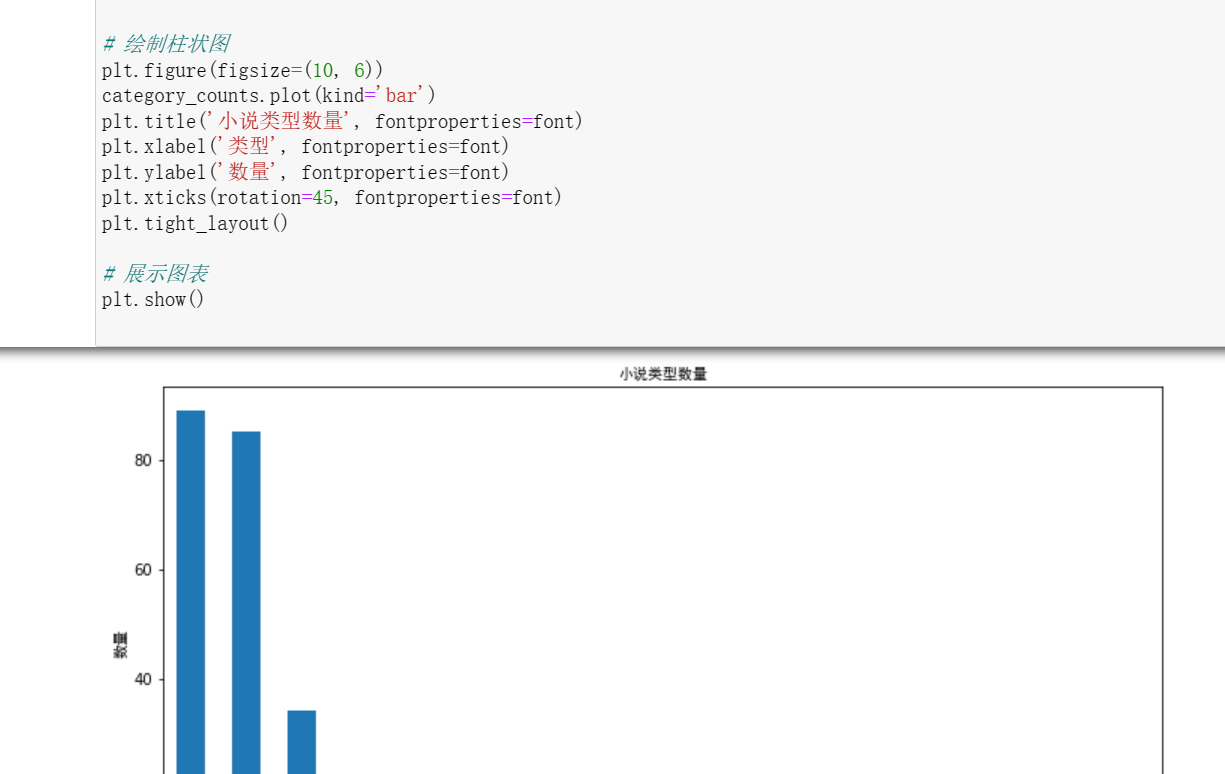
 1 import pandas as pd
 2 from matplotlib.font_manager import FontProperties
 3
 4 # 读取Excel文件中的数据
 5 file_path = 'D:\gui\gui work.xlsx'
 6 df = pd.read_excel(file_path)
 7
 8 # 统计不同类型的小说数量
 9 category_counts = df['类型'].value_counts()
10
11
12 # 绘制柱状图
13 plt.figure(figsize=(10, 6))
14 category_counts.plot(kind='bar')
15 plt.title('小说类型数量', fontproperties=font)
16 plt.xlabel('类型', fontproperties=font)
17 plt.ylabel('数量', fontproperties=font)
18 plt.xticks(rotation=45, fontproperties=font)
19 plt.tight_layout()
20
21 # 展示图表
22 plt.show()
以下是全部代码的展示
  1 import requests
  2 from bs4 import BeautifulSoup
  3 from openpyxl import Workbook
  4
  5 base_url = 'https://www.hongxiu.com/category/f1_f1_f1_f1_f1_f1_0_'
  6 page_count = 40  # 爬取的总页数
  7
  8 # 创建Excel
  9 workbook = Workbook()
 10 sheet = workbook.active
 11
 12 # 表头
 13 sheet['A1'] = '名称'
 14 sheet['B1'] = '作者'
 15 sheet['C1'] = '类型'
 16 sheet['D1'] = '是否完结'
 17 sheet['E1'] = '人气'
 18 sheet['F1'] = '简介'
 19
 20 row = 2  # 从第二行开始写入数据
 21
 22 # 循环遍历每一页
 23 for page in range(1, page_count + 1):
 24     url = base_url + str(page)
 25
 26     # 发送HTTP请求获取页面内容
 27     response = requests.get(url)
 28     content = response.text
 29
 30     # 使用BeautifulSoup解析HTML内容
 31     soup = BeautifulSoup(content, 'html.parser')
 32
 33     # 找到小说所在的HTML元素
 34     novel_list = soup.find_all('div', class_='book-info')
 35
 36     # 遍历小说列表,提取所需信息
 37     for novel in novel_list:
 38         # 提取小说名称
 39         name = novel.find('h3').a.text.strip()
 40
 41         # 提取作者
 42         author = novel.find('h4').a.text.strip()
 43
 44         # 提取类型
 45         category = novel.find('span', class_='org').text.strip()
 46
 47         # 提取是否完结
 48         is_complete = novel.find('span', class_='pink').text.strip()
 49
 50         # 提取人气
 51         popularity = novel.find('span', class_='blue').text.strip()
 52
 53         # 提取简介
 54         intro = novel.find('p', class_='intro').text.strip()
 55
 56         # 将数据写入Excel
 57         sheet['A' + str(row)] = name
 58         sheet['B' + str(row)] = author
 59         sheet['C' + str(row)] = category
 60         sheet['D' + str(row)] = is_complete
 61         sheet['E' + str(row)] = popularity
 62         sheet['F' + str(row)] = intro
 63
 64         row += 1
 65
 66 # 保存Excel文件
 67 file_path = 'D:\gui\gui work.xlsx'
 68 workbook.save(file_path)
 69
 70 print('数据已成功保存到Excel文件:', file_path)
 71 import pandas as pd
 72 from pyecharts import options as opts
 73 from pyecharts.charts import Pie
 74
 75 # 读取Excel文件中的数据
 76 file_path = 'D:\gui\gui work.xlsx'
 77 df = pd.read_excel(file_path)
 78
 79 # 统计不同类型小说的数量
 80 category_counts = df['类型'].value_counts()
 81
 82 # 创建饼图
 83 pie = (
 84     Pie()
 85     .add(
 86         '',
 87         [list(z) for z in zip(category_counts.index, category_counts.values)],
 88         radius=['40%', '70%']
 89     )
 90     .set_global_opts(
 91         title_opts=opts.TitleOpts(title="小说类型占比"),
 92         legend_opts=opts.LegendOpts(orient="vertical", pos_top="15%", pos_left="2%")
 93     )
 94     .set_series_opts(label_opts=opts.LabelOpts(formatter="{b}: {c}"))
 95 )
 96
 97 # 保存饼图为PNG文件
 98 pie.render('D:\gui\pie_chart.html')
 99 png_file_path = 'D:\gui\pie_chart.png'
100 pie.render(png_file_path)
101
102 print('饼图已成功保存为PNG文件:', png_file_path)
103 import pandas as pd
104 from pyecharts import options as opts
105 from pyecharts.charts import Pie
106
107 # 读取Excel文件中的数据
108 file_path = 'D:\gui\gui work.xlsx'
109 df = pd.read_excel(file_path)
110
111 # 统计已完结和连载中小说的数量
112 complete_count = df[df['是否完结'] == '已完结'].shape[0]
113 ongoing_count = df[df['是否完结'] == '连载中'].shape[0]
114
115 # 创建饼图
116 pie = (
117     Pie()
118     .add(
119         '',
120         [('已完结', complete_count), ('连载中', ongoing_count)],
121         radius=['40%', '70%']
122     )
123     .set_global_opts(
124         title_opts=opts.TitleOpts(title="完结小说占比"),
125         legend_opts=opts.LegendOpts(orient="vertical", pos_top="15%", pos_left="2%")
126     )
127     .set_series_opts(label_opts=opts.LabelOpts(formatter="{b}: {c}"))
128 )
129
130
131 png_file_path = 'D:\gui\pie_chart1.png'
132 pie.render(png_file_path)
133
134 print('饼图已成功保存为PNG文件:', png_file_path)
135 import pandas as pd
136 from pyecharts import options as opts
137 from pyecharts.charts import Pie
138
139
140 file_path = 'D:\gui\gui work.xlsx'
141 df = pd.read_excel(file_path)
142
143 # 统计已完结和连载中小说的数量
144 complete_count = df[df['是否完结'] == '已完结'].shape[0]
145 ongoing_count = df[df['是否完结'] == '连载中'].shape[0]
146
147
148 pie = (
149     Pie()
150     .add(
151         '',
152         [('已完结', complete_count), ('连载中', ongoing_count)],
153         radius=['40%', '70%']
154     )
155     .set_global_opts(
156         title_opts=opts.TitleOpts(title="完结小说占比"),
157         legend_opts=opts.LegendOpts(orient="vertical", pos_top="15%", pos_left="2%")
158     )
159     .set_series_opts(label_opts=opts.LabelOpts(formatter="{b}: {c}"))
160 )
161
162
163 png_file_path = 'D:\gui\pie_chart1.png'
164 pie.render(png_file_path)
165
166 print('饼图已成功保存为PNG文件:', png_file_path)
167 import pandas as pd
168 from pyecharts import options as opts
169 from pyecharts.charts import Pie
170
171 # 读取Excel文件中的数据
172 file_path = 'D:\gui\gui work.xlsx'
173 df = pd.read_excel(file_path)
174
175 # 统计言情小说作家的热度
176 author_counts = df[df['类型'] == '现代言情']['作者'].value_counts()
177
178
179 pie = (
180 Pie()
181 .add(
182 '',
183 [list(z) for z in zip(author_counts.index, author_counts.values)],
184 radius=['40%', '70%']
185 )
186 .set_global_opts(
187 title_opts=opts.TitleOpts(title="言情小说作家热度"),
188 legend_opts=opts.LegendOpts(orient="vertical", pos_top="15%", pos_left="2%")
189 )
190 .set_series_opts(label_opts=opts.LabelOpts(formatter="{b}: {c}"))
191 )
192
193
194 png_file_path = 'D:\gui\pie_chart3.png'
195 pie.render(png_file_path)
196
197 print('饼图已成功保存为PNG文件:', png_file_path)
198 import pandas as pd
199
200
201 file_path = 'D:\gui\gui work.xlsx'
202 df = pd.read_excel(file_path)
203
204 # 按人气降序排列,并选择前20名
205 top_20_books = df.sort_values(by='人气', ascending=False).head(20)
206
207 # 设置显示的列名
208 columns = ['图书名称', '作者', '类型', '是否完结', '人气', '简介']
209
210 # 生成表格
211 table = pd.DataFrame(top_20_books, columns=columns)
212
213 # 打印表格
214 print(table)
215 import pandas as pd
216
217 # 读取Excel文件中的数据
218 file_path = 'D:\gui\gui work.xlsx'
219 df = pd.read_excel(file_path)
220
221 # 按人气降序排列,并选择前20名
222 top_20_authors = df['作者'].value_counts().head(20)
223
224 # 生成排行榜表格
225 rank_table = pd.DataFrame({'作者': top_20_authors.index, '图书数量': top_20_authors.values})
226
227 # 设置排名列
228 rank_table['排名'] = rank_table.index + 1
229
230 # 调整列的顺序
231 rank_table = rank_table[['排名', '作者', '图书数量']]
232
233 # 打印排行榜表格
234 print(rank_table)
235 import pandas as pd
236
237 # 读取Excel文件中的数据
238 file_path = 'D:\\gui\\gui work.xlsx'
239 df = pd.read_excel(file_path)
240
241 # 按人气降序排列,并选择前20名
242 top_20_authors = df['作者'].value_counts().head(20)
243
244 # 生成排行榜表格
245 rank_table = pd.DataFrame({'作者': top_20_authors.index, '图书数量': top_20_authors.values})
246
247 # 设置排名列
248 rank_table['排名'] = rank_table.index + 1
249
250 # 调整列的顺序
251 rank_table = rank_table[['排名', '作者', '图书数量']]
252
253 # 打印排行榜表格
254 print(rank_table)
四.总结
爬取了红袖添香网站小说页面数据
经过此次的爬虫 我也发现了我的不足 对代码的简易化还不够灵活 出现的问题得即使翻找文献重新构思
通过这次利用数据分析小说网站数据,让我掌握了最基础的数据分析知识,并且可以帮助我快速找到需要的书籍。此次代码还有许多不足之处,正加强学习
望老师批评指正 本人承诺只有参考 没有抄袭的成分 同时也感谢老师的教导 让我找到了学习python的乐趣!
我们需要用到基础的BeautifulSoup,pandas库等 我参考了csdn上的手把手教你用Python爬取小说某网数据,并进行可视化分析 - 知乎 (zhihu.com)

 浙公网安备 33010602011771号