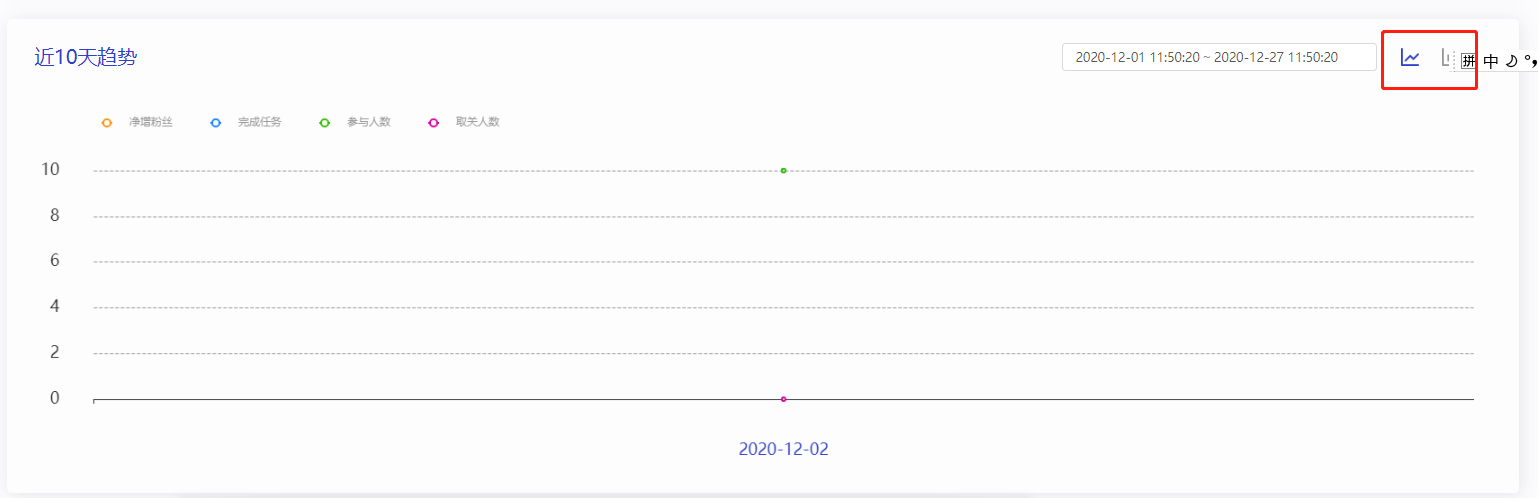
vue+echart 点击图表切换 类型 由 line 到bar

代码:
<template>
  <div class="container-echart">
    <div class="lineWrap">
      <div class="line_header">
        <span class="line-name">近10天趋势</span>
      </div>
      <div>
        <a-row type="flex">
          <a-range-picker
            format="YYYY-MM-DD HH:mm:ss"
            :defaultValue="[momentTime(startTime, 'YYYY-MM-DD HH:mm:ss'), momentTime(endTime, 'YYYY-MM-DD HH:mm:ss')]"
            :placeholder="['开始时间', '结束时间']"
            :showTime="{defaultValue:[momentTime('00:00:00', 'HH:mm:ss'), momentTime('23:59:59', 'HH:mm:ss')]}"
            @ok="onOk"
          />
          <div class="flex-img" @click="changOption">
            <img :src="flag== true ? require('@/assets/images/statistics/analytics-graph-chart.png'): require('@/assets/images/statistics/analytics-graph-chart3.png')" class="mr26 ml26" />
            <img :src="flag== true ? require('@/assets/images/statistics/analytics-graph-chart1.png'): require('@/assets/images/statistics/analytics-graph-chart2.png')" />
          </div>
        </a-row>
      </div>
    </div>
    <div id="chart_journal" style="height:400px;width: 100%"></div>
  </div>
</template>
<script>
  import echarts from '@/utils/echarts'
  import moment from 'moment'
  import { getTrend } from '@/api/activity'
  export default {
    props: {
      curStep: {
        type: Number,
        required: true
      }
    },
    data() {
      return {
        mpId: this.$route.params.code,
        activityId: this.$route.query.id,
        flag: true,
        startTime: moment(new Date()).subtract(10, 'days').format('YYYY-MM-DD HH:mm:ss'),
        endTime:  moment(new Date()).subtract(1, 'days').format('YYYY-MM-DD HH:mm:ss'),
        start: parseInt(moment(moment(new Date()).subtract(10, 'days').format('YYYY-MM-DD HH:mm:ss')).valueOf()/1000),  // 默认最近10 天的开始时间
        end: parseInt(moment(moment(new Date()).subtract(1, 'days').format('YYYY-MM-DD HH:mm:ss')).valueOf()/1000), // 默认最近10 天的结束时间
        xData:[],
        fans:[],
        tasks:[],
        joins:[],
        passs:[],
        lock:false
      }
    },
    watch: {
      curStep (newVal) {
        if (newVal === 1&&this.lock === false) {
          // 调用绘制图表的方法
          this.getEchartDate(true)
        }
      }
    },
    methods: {
      momentTime (time, format) {
        return moment(time, format)
      },
      changOption () {
        this.flag = !this.flag
        this.getEchartDate(this.flag)
      },
      onOk(value) {
        if(value) {
          let start = this.dateToMs(value[0])
          let end = this.dateToMs(value[1])
          this.start = parseInt(start)
          this.end  = parseInt(end)
          this.getEchartDate(this.flag)
        }
      },
      //将中国标准时间转换为时间戳
      dateToMs (date) {
        let result = new Date(date).getTime()
        return result/1000
      },
      async getEchartDate (type) {
        this.lock = true
        // 获取到echart 初始化echart
        let chart = echarts.init(document.getElementById('chart_journal'))
        // 初始化图表
        this.init(type)
        // 切换数据 必须赋值为空
        this.xData = []
        this.fans = []
        this.tasks = []
        this.joins = []
        this.passs = []
        let params = {
          mpId: this.mpId,
          activityId: this.activityId,
          info: {
            start: this.start,
            end: this.end
          }
        }
        const  {data} = await getTrend(params)
        let echartData = data.data.entries
        echartData.map(item=>{
          this.xData.push(item.createTime)
          this.fans.push(item.netGrowthNum)
          this.tasks.push(item.finishNum)
          this.joins.push(item.joinNum)
          this.passs.push(item.noSubscribeNum)
        })
        if (echartData.length  === 0) {
          this.xData = '-'
          this.fans=[0]
          this.tasks=[0]
          this.joins=[0]
          this.passs=[0]
        }
        // 重组数据
        chart.setOption({ //加载数据图表
          xAxis : {
            data : this.xData
          },
          series : [
            {
              // 根据名字对应到相应的系列
              data : this.fans
            },
            {
              // 根据名字对应到相应的系列
              data : this.tasks
            },
            {
              data: this.joins
            },
            {
              data: this.passs
            }
          ]
        })
      },
      init(type) {
        let chart = echarts.init(document.getElementById('chart_journal'))
        let option = {
          // backgroundColor:'#2A2C64',
          tooltip: {
            trigger: 'axis',
            axisPointer: { // 坐标轴指示器,坐标轴触发有效
              type: 'shadow' // 默认为直线,可选为:'line' | 'shadow'
            }
          },
          grid: {
            left: '4%',
            right: '3%',
            bottom: '14%',
            top:'16%',
            containLabel: true
          },
          legend: {
            data: ['净增粉丝', '完成任务', '参与人数', '取关人数'],
            left: 100,
            textStyle: {
              color: "#989898",
              padding: [14, 14, 14, 14]
            },
            itemWidth: 12,
            itemHeight: 10,
            itemGap: 42
          },
          xAxis: {
            type: 'category',
            data: [],
            axisLine: {
              lineStyle: {
                color: '#2F2F2F',
              }
            },
            axisLabel: {
              fontSize: 18,
              fontFamily: 500,
              lineHeight: 20,
              height: 20,
              width: 47,
              padding: [39, 40, 48, 40],
              textStyle: {
                fontFamily: 'Roboto, Roboto-Medium',
                color: '#2f40cb',
                fontWeight: '500'
              }
            },
          },
          yAxis: {
            type: 'value',
            data: [],
            axisLine: {
              show: false,
              lineStyle: {
                color: 'white',
              }
            },
            splitLine: {
              show: true,
              lineStyle: {
                color: '#989898',
                type: "dashed"
              }
            },
            axisLabel: {
              fontSize: 18,
              fontFamily: 500,
              lineHeight: 20,
              height: 20,
              width: 47,
              padding: [10, 30, 0, 0],
              textStyle: {
                fontFamily: 'Roboto, Roboto-Medium',
                color: '#333333',
                fontWeight: '500'
              }
            }
          },
          series: [
            {
              name: '净增粉丝',
              type: (type === true) ? 'line' : 'bar',
              barWidth: '8px',
              itemStyle: {
                normal:{
                  color:'#FB9513'
                }
              },
              data: []
            },
            {
              name: '完成任务',
              type: (type === true) ? 'line' : 'bar',
              barWidth: '8px',
              itemStyle: {
                normal:{
                  color:'#1B85FF'
                }
              },
              data: []
            },
            {
              name: '参与人数',
              type: (type === true) ? 'line' : 'bar',
              barWidth: '8px',
              itemStyle: {
                normal:{
                  color:'#30C300'
                }
              },
              data: []
            },
            {
              name: '取关人数',
              type: (type === true) ? 'line' : 'bar',
              barWidth: '8px',
              itemStyle: {
                normal:{
                  color:'#DD00A6'
                }
              },
              data: []
            }
          ]
        }
        chart.setOption(option)
      }
    }
  }
</script>

<style  scoped>
  .income-i-left {
    width:10px;
    height:10px;
    background:rgba(217,238,236,1);
    display: inline-block;
    border-radius: 50%;
  }
  .container-echart {
    height: 526px;
    margin-top: 33px;
    background: #fdfdfd;
    border-radius: 5px;
    box-shadow: 2px 2px 20px 0px rgba(47,47,47,0.11);
  }
  .line_header {
    width: 115px;
    height: 24px;
    font-size: 22px;
    font-family: PingFangSC, PingFangSC-Medium;
    font-weight: 500;
    text-align: left;
    line-height: 24px;
    margin-top: 30px;
    margin-bottom: 30px;
  }
  .line-name {
    width: 115px;
    height: 24px;
    font-size: 22px;
    font-family: PingFangSC, PingFangSC-Medium;
    font-weight: 500;
    text-align: left;
    color: #2f40cb;
    line-height: 24px;
  }
  .lineWrap {
    margin-right: 66px;
    display: flex;
    flex-direction: row;
    justify-content: space-between;
    align-items: center;
    margin-bottom: 20px;
    margin-left: 30px;
  }
  .flex-img {
    display: flex;
    align-items: center;
    justify-content: center;
  }
</style>
越努力越幸运

 浙公网安备 33010602011771号