
[writeup]0ctf2015-x-y-z
这是一道非常有意思的MISC题,通过这道题目切实感受到了python的强大,以后还需要继续探索python的功能。
我们拿到的文件是x-y-z,打开后是这个样子的:
-4.751373,-2.622809,2.428588;-4.435134,-3.046589,2.406030;-4.788052,-2.661979,2.464709
-4.692748,-2.599611,2.629112;-4.656070,-2.560445,2.592991;-4.788052,-2.661979,2.464709
-4.692748,-2.599611,2.629112;-4.788052,-2.661979,2.464709;-4.435134,-3.046589,2.406030
-4.656070,-2.560445,2.592991;-4.516017,-2.714652,2.570303;-4.751373,-2.622809,2.428588
-4.656070,-2.560445,2.592991;-4.751373,-2.622809,2.428588;-4.788052,-2.661979,2.464709
-4.611258,-2.777269,2.405960;-4.435134,-3.046589,2.406030;-4.751373,-2.622809,2.428588
-4.572725,-2.644557,2.333280;-4.603014,-2.680354,2.364417;-4.592222,-2.663824,2.351891
-4.571442,-2.773632,2.381504;-4.564917,-2.826000,2.397583;-4.611258,-2.777269,2.405960
-4.571436,-2.742115,2.369542;-4.571442,-2.773632,2.381504;-4.611258,-2.777269,2.405960
-4.571436,-2.742115,2.369542;-4.611258,-2.777269,2.405960;-4.567214,-2.723559,2.360054
-4.567214,-2.723559,2.360054;-4.611258,-2.777269,2.405960;-4.560604,-2.711404,2.351613
-4.564917,-2.826000,2.397583;-4.435134,-3.046589,2.406030;-4.611258,-2.777269,2.405960
-4.560604,-2.711404,2.351613;-4.611258,-2.777269,2.405960;-4.614635,-2.748184,2.396883
-4.560604,-2.711404,2.351613;-4.614635,-2.748184,2.396883;-4.550966,-2.700433,2.341865
-4.550966,-2.700433,2.341865;-4.614635,-2.748184,2.396883;-4.487547,-2.638955,2.281782
-4.549636,-2.632259,2.315231;-4.603014,-2.680354,2.364417;-4.572725,-2.644557,2.333280
-4.549636,-2.632259,2.315231;-4.610334,-2.699016,2.375741;-4.603014,-2.680354,2.364417
-4.527911,-2.628901,2.301369;-4.610334,-2.699016,2.375741;-4.549636,-2.632259,2.315231
-4.527911,-2.628901,2.301369;-4.613989,-2.720536,2.386025;-4.610334,-2.699016,2.375741
-4.520168,-2.660726,2.552253;-4.503999,-2.610110,2.523680;-4.603670,-2.681133,2.365094
-4.520168,-2.660726,2.552253;-4.603670,-2.681133,2.365094;-4.615032,-2.721270,2.386904
-4.520168,-2.660726,2.552253;-4.615032,-2.721270,2.386904;-4.611408,-2.777297,2.406055
-4.519550,-2.678409,2.558603;-4.409416,-2.569654,2.453505;-4.439031,-2.566490,2.469471
-4.519550,-2.678409,2.558603;-4.439031,-2.566490,2.469471;-4.517775,-2.650094,2.546833
-4.517775,-2.650094,2.546833;-4.439031,-2.566490,2.469471;-4.513590,-2.632298,2.537659
-4.516128,-2.714683,2.570382;-4.409416,-2.569654,2.453505;-4.519550,-2.678409,2.558603
-4.516128,-2.714683,2.570382;-4.462389,-2.645243,2.512886;-4.409416,-2.569654,2.453505
........
很明显,这是一系列三维空间的坐标。猜想题目是想让我们把这些三维空间的点绘制出来,通过绘制出的图形应该能得到flag。
Python有一套非常强大的绘图工具库matplotlib,官方站点:
http://matplotlib.org/gallery.html
这个站点上有大量实际的例子,参考这些例子,我们做少量的代码修改就能够绘制出各种各样的图形。
通过python脚本将这些坐标点解析并绘制出来,然后观察是否能够得到flag,脚本如下:
 1 #!/usr/bin/python
 2
 3 #http://matplotlib.org/api/pyplot_api.html
 4
 5 from mpl_toolkits.mplot3d import Axes3D
 6 import matplotlib.pyplot as plt
 7 import numpy as np
 8
 9 xs=()
10 ys=()
11 zs=()
12
13 with open("x-y-z", "r") as fxyz:
14     lines = fxyz.readlines()
15     for line in lines:
16         points = line.strip().split(';')
17         for point in points:
18             xs = xs + (float(point.split(',')[0]),)
19             ys = ys + (float(point.split(',')[1]),)
20             zs = zs + (float(point.split(',')[2]),)
21     fxyz.close()
22
23 fig = plt.figure()
24 ax = fig.add_subplot(111, projection='3d')
25 ax.scatter(xs, ys, zs, marker='o', s=1)
26
27 ax.set_xlabel('X Label')
28 ax.set_ylabel('Y Label')
29 ax.set_zlabel('Z Label')
30
31 plt.show()
画图还是比较费时的,在我的虚拟机上等待大概90秒后,绘图完成,如下:
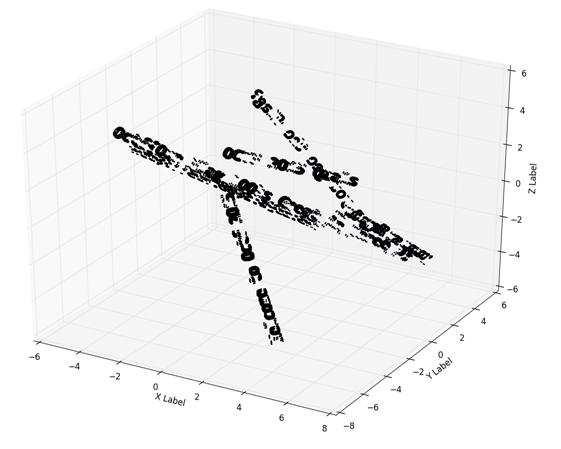
图片比较模糊,能够大致看出0ctf等字样,但是想提取flag还是比较难得。后来发现图片是可以旋转的,旋转之后看起来好一些了:
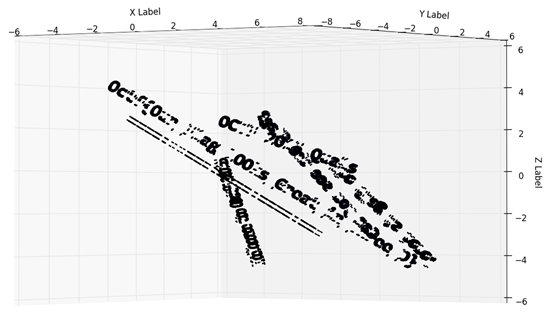
从图中能大概看到0ctf,flag,Great等字样,但是其他部分很不清楚,仍然难以读出flag。
后来想了想,题目本身是否还有其他提示呢?我们发现x-y-z文件的一行中有三个点,这三个点是可以构成一个三角形的。如果我们将这一个个的三角形绘出,是否会有更好的效果呢?
在原来的脚本上进行必要的修改,如下:
#!/usr/bin/python

#http://matplotlib.org/api/pyplot_api.html

from mpl_toolkits.mplot3d import Axes3D
import matplotlib.pyplot as plt
import numpy as np

xs, ys, zs = [],[],[]

with open("x-y-z", "r") as fxyz:
    lines = fxyz.readlines()
    for line in lines:
        points = line.strip().split(';')
        px,py,pz = [],[],[]
        for point in points:
            px.append(float(point.split(',')[0]))
            py.append(float(point.split(',')[1]))
            pz.append(float(point.split(',')[2]))

        xs.append(px)
        ys.append(py)
        zs.append(pz)

    fxyz.close()

fig = plt.figure()
ax = fig.add_subplot(111, projection='3d')

surf = []
for i in xrange(0, len(xs)):
    #draw triangles one by one
    surf.append(ax.plot_trisurf(xs[i], ys[i], zs[i], linewidth=0))

ax.set_xlabel('X')
ax.set_ylabel('Y')
ax.set_zlabel('Z')

plt.show()
然后运行,同样等待大概90秒后绘图结束,生成的图形如下:

可以看到,图片非常清晰,此时的Flag也是非常清楚的。需要注意的是,其中的圆圈都是数字’0’,而不是字母’o’。
至此完成,再次有感于python的强大,当然思路也是非常关键的。

 浙公网安备 33010602011771号