
硬盘测试
一.磁盘调度算法介绍
查看磁盘用的调度算法
[root@localhost ~]# cat /sys/block/sda/queue/scheduler
noop [deadline] cfq
1.CFQ
CFQ把I/O的请求按照进程分别放入进程对应的队列中,所以A进程和B进程发出的I/O请求会在两个队列中。而各个队列内部仍然采用合并和排序的方法,区别仅在于,每一个提交I/O请求的进程都有自己的I/O队列。
CFQ的“公平”是针对进程而言的,它以时间片算法为前提,轮转调度队列,默认从当前队列中取4个请求处理,然后处理下一个队列的4个请求。这样就可以确保每个进程享有的I/O资源是均衡的。
CFQ的缺点是先来的IO请求不一定能被及时满足,可能出现饥饿的情况。
CFQ Wki
2.Deadline
同CFQ一样,除了维护一个拥有合并和排序功能的请求队列以外,还额外维护了两个队列,分别是读请求队列和写请求队列,他们都是带有超时的FIFO队列。当新来的一个I/O请求时,会被同时插入普通队列和读/写队列,然后处理普通队列中的请求。当调度器发现读/写请求队列中的请求超时的时候,会优先处理这些请求,保证尽可能不产生请求饥饿
在Deadline算法中,每个I/O请求都有一个超时时间,默认读请求是500ms, 写请求是5s。
Deadline Wiki
3.Noop
Noop做的事情非常简单,它不会对I/O请求排序也不会进行任何其他优化(除了合并)。Noop 除了对请求合并以外,不再进行任何处理,直接以类似FIFO的顺序提交I/O请求。
Noop面向的不是普通的块设备,而是随机访问设备(例如SSD),对于这种设备,不存在传统的寻道时间,那么久没有必要去做那些多余的为了减少寻道时间而采取的事情了
Noop Wiki
=====================姜老师的理解=========================
CFQ有些请求会按照比较顺序的访问,对其他的请求可能会有一些延时比较大。
NOOP不进行排序,顺序发过来就是什么顺序,根据顺序去请求。比较符合SSD的特性。因为SSD的随机性足够好了没必要进行排序。一旦排序有些操作就会出现竞争,出现饥饿情况了。
Deadline改进了CFQ,是把访问请求分别放在读和写的队列里,根据不同的请求在来比较顺序去进行排序,读的请求优先级高于写的请求的。
NOOP和Deadline都可以选择,CFQ肯定是不行的。比CFQ性能高于30%左右。NOOP和Deadline没什么太大差别,%1左右的差别吧。数据库角度来看的话,两者都可以。
==============================================
二.iostat(下)
rrqm/s 和 wrqm/s
Merge 将若干个连续地址的IO请求进行合并。来提高IO的效率
rrqm/s 是每秒读(read) 请求合并的次数
wrqm/s 是每秒写(write) 请求合并的次数
合并的意思就是:例如:存储上的数据存的是4K的块,上层发来了两个请求,这两个请求的数据块正好挨着在一起,内核就会把这两个请求合并成一个请求成为8K的块,这样就只占用一次IO,不用占用两次IO了。从性能上来说会有好处的。毕竟每秒的IOPS是有指标的,这样性能就提高了。
r/s和w/s
在合并之后(alter merge) IO请求的次数
r/s 合并之后每秒读IO的次数
w/s 合并之后每秒写IO的次数
r/s + w/s = IOPS
rsec/s (rKB/s、rMB/s) 和 wsec/s (wKB/s、wMB/s)
sec是Sector(扇区),在磁盘上扇区的大小是固定的,是512字节
rsec/s 每秒读多少个扇区
wsec/s 每秒写多少个扇区
因为一个扇区是512字节,读和写了多少扇区就可以转换为多少KB/MB的字节数了。
avgrq-sz
一块磁盘可能存储数据的同时还存储日志,所以请求的IO大小是不一样的
该参数就是平均的请求数,注意:该值需要*512字节才是最终的结果,因为该值是以扇区为单位的。
avgqu-sz
请求的IO队列的平均长度(比较重要)
HDD可能在4左右,SSD可以达到30,甚至可能更高。
await、 r_await、 w_await
IO请求平均等待的时间,单位是ms
r_await和w_await 分别对应 读IO请求的等待和写IO请求的等待
svctm
服务于IO请求的平均时间
man文档中提示不要相信该值,以后会被移除
%util
磁盘是否空闲,不能简单的等同于IO的使用率,该值可以解释为磁盘是否繁忙。
如果该值100%不能简单的等同于磁盘的负载满了,达到了瓶颈
需要综合avgqu-sz、 await等其他指标进行综合判断磁盘是否达到瓶颈
三、MySQL的IO使用情况
1.iotop
yum -y install iotop
iotop -u mysql ##### -u 表示监控哪个user的进程,所以前提是你的MySQL服务是用MySQL用户启动的
注意:上述命令只能看到MySQL的线程ID(Thread ID)不能看到线程具体在操作什么。
2.performance_schema.threads
use performance_schema;
mysql> desc threads;
+---------------------+---------------------+------+-----+---------+-------+
| Field | Type | Null | Key | Default | Extra |
+---------------------+---------------------+------+-----+---------+-------+
| THREAD_ID | bigint(20) unsigned | NO | | NULL | | -- MySQL内部线程ID
| NAME | varchar(128) | NO | | NULL | |
| TYPE | varchar(10) | NO | | NULL | |
| PROCESSLIST_ID | bigint(20) unsigned | YES | | NULL | |
| PROCESSLIST_USER | varchar(32) | YES | | NULL | |
| PROCESSLIST_HOST | varchar(60) | YES | | NULL | |
| PROCESSLIST_DB | varchar(64) | YES | | NULL | |
| PROCESSLIST_COMMAND | varchar(16) | YES | | NULL | |
| PROCESSLIST_TIME | bigint(20) | YES | | NULL | |
| PROCESSLIST_STATE | varchar(64) | YES | | NULL | |
| PROCESSLIST_INFO | longtext | YES | | NULL | |
| PARENT_THREAD_ID | bigint(20) unsigned | YES | | NULL | |
| ROLE | varchar(64) | YES | | NULL | |
| INSTRUMENTED | enum('YES','NO') | NO | | NULL | |
| HISTORY | enum('YES','NO') | NO | | NULL | |
| CONNECTION_TYPE | varchar(16) | YES | | NULL | |
| THREAD_OS_ID | bigint(20) unsigned | YES | | NULL | | --操作系统的线程ID
+---------------------+---------------------+------+-----+---------+-------+
17 rows in set (0.00 sec)
select name,type,thread_id,thread_os_id from threads;
+----------------------------------------+------------+-----------+--------------+
| name | type | thread_id | thread_os_id |
+----------------------------------------+------------+-----------+--------------+
| thread/sql/main | BACKGROUND | 1 | 3611 |
| thread/sql/thread_timer_notifier | BACKGROUND | 2 | 3662 |
| thread/innodb/io_ibuf_thread | BACKGROUND | 3 | 3687 |
| thread/innodb/io_log_thread | BACKGROUND | 4 | 3688 |
| thread/innodb/io_read_thread | BACKGROUND | 5 | 3689 |
| thread/innodb/io_read_thread | BACKGROUND | 6 | 3690 |
| thread/innodb/io_read_thread | BACKGROUND | 7 | 3691 |
| thread/innodb/io_read_thread | BACKGROUND | 8 | 3692 |
| thread/innodb/io_write_thread | BACKGROUND | 9 | 3693 |
| thread/innodb/io_write_thread | BACKGROUND | 10 | 3694 |
| thread/innodb/io_write_thread | BACKGROUND | 11 | 3695 |
| thread/innodb/io_write_thread | BACKGROUND | 12 | 3696 |
| thread/innodb/page_cleaner_thread | BACKGROUND | 13 | 3697 |
| thread/innodb/srv_error_monitor_thread | BACKGROUND | 15 | 3740 |
| thread/innodb/srv_monitor_thread | BACKGROUND | 16 | 3741 |
| thread/innodb/srv_lock_timeout_thread | BACKGROUND | 17 | 3739 |
| thread/innodb/srv_master_thread | BACKGROUND | 18 | 3742 | -- MySQL 主线程和ID
| thread/innodb/srv_purge_thread | BACKGROUND | 19 | 3743 |
| thread/innodb/srv_worker_thread | BACKGROUND | 20 | 3744 |
| thread/innodb/srv_worker_thread | BACKGROUND | 21 | 3745 |
| thread/innodb/srv_worker_thread | BACKGROUND | 22 | 3746 |
| thread/innodb/dict_stats_thread | BACKGROUND | 23 | 3748 |
| thread/innodb/buf_dump_thread | BACKGROUND | 24 | 3747 |
| thread/semisync/Ack_receiver | BACKGROUND | 25 | 3752 |
| thread/sql/signal_handler | BACKGROUND | 26 | 3773 |
| thread/sql/compress_gtid_table | FOREGROUND | 28 | 3774 |
| thread/sql/one_connection | FOREGROUND | 29 | 4991 | -- FOREGROUND 前台线程
+----------------------------------------+------------+-----------+--------------+
27 rows in set (0.00 sec)
---- thread/sql/one_connection 就是我连接的线程
select name,type,thread_id,thread_os_id,processlist_id from threads; -- 查看processlist_id
+----------------------------------------+------------+-----------+--------------+----------------+
| name | type | thread_id | thread_os_id | processlist_id |
+----------------------------------------+------------+-----------+--------------+----------------+
| thread/sql/main | BACKGROUND | 1 | 3611 | NULL |
| thread/sql/thread_timer_notifier | BACKGROUND | 2 | 3662 | NULL |
| thread/innodb/io_ibuf_thread | BACKGROUND | 3 | 3687 | NULL |
| thread/innodb/io_log_thread | BACKGROUND | 4 | 3688 | NULL |
| thread/innodb/io_read_thread | BACKGROUND | 5 | 3689 | NULL |
| thread/innodb/io_read_thread | BACKGROUND | 6 | 3690 | NULL |
| thread/innodb/io_read_thread | BACKGROUND | 7 | 3691 | NULL |
| thread/innodb/io_read_thread | BACKGROUND | 8 | 3692 | NULL |
| thread/innodb/io_write_thread | BACKGROUND | 9 | 3693 | NULL |
| thread/innodb/io_write_thread | BACKGROUND | 10 | 3694 | NULL |
| thread/innodb/io_write_thread | BACKGROUND | 11 | 3695 | NULL |
| thread/innodb/io_write_thread | BACKGROUND | 12 | 3696 | NULL |
| thread/innodb/page_cleaner_thread | BACKGROUND | 13 | 3697 | NULL |
| thread/innodb/srv_error_monitor_thread | BACKGROUND | 15 | 3740 | NULL |
| thread/innodb/srv_monitor_thread | BACKGROUND | 16 | 3741 | NULL |
| thread/innodb/srv_lock_timeout_thread | BACKGROUND | 17 | 3739 | NULL |
| thread/innodb/srv_master_thread | BACKGROUND | 18 | 3742 | NULL |
| thread/innodb/srv_purge_thread | BACKGROUND | 19 | 3743 | NULL |
| thread/innodb/srv_worker_thread | BACKGROUND | 20 | 3744 | NULL |
| thread/innodb/srv_worker_thread | BACKGROUND | 21 | 3745 | NULL |
| thread/innodb/srv_worker_thread | BACKGROUND | 22 | 3746 | NULL |
| thread/innodb/dict_stats_thread | BACKGROUND | 23 | 3748 | NULL |
| thread/innodb/buf_dump_thread | BACKGROUND | 24 | 3747 | NULL |
| thread/semisync/Ack_receiver | BACKGROUND | 25 | 3752 | NULL |
| thread/sql/signal_handler | BACKGROUND | 26 | 3773 | NULL |
| thread/sql/compress_gtid_table | FOREGROUND | 28 | 3774 | 1 |
| thread/sql/one_connection | FOREGROUND | 29 | 4991 | 3 |
+----------------------------------------+------------+-----------+--------------+----------------+
27 rows in set (0.00 sec)
---- processlist_id 对应的就是show processlist中的id
show processlist
+----+------+-----------+--------------------+---------+------+----------+------------------+
| Id | User | Host | db | Command | Time | State | Info |
+----+------+-----------+--------------------+---------+------+----------+------------------+
| 3 | root | localhost | performance_schema | Query | 0 | starting | show processlist |
+----+------+-----------+--------------------+---------+------+----------+------------------+
1 row in set (0.00 sec)
mysql> select connection_id(); -- 查看当前 connection的id
+-----------------+
| connection_id() |
+-----------------+
| 3 |
+-----------------+
1 row in set (0.04 sec)
通过threads表中的信息,结合iotop -u mysql 的输出,就可以知道某个线程的IO使用情况。
MySQL5.6版本中没有 thread_os_id这个列。
作业:如何将iotop中的Thread ID和MySQL5.6中的threads表中的信息对应起来?
注意:
如果有个用户对这张表每行都进行更新的话,就会产生锁的情况,其他线程就会等待这张表的锁释放,这个时候通过IO来查看的话就会看不出锁的问题。所以一定要注意这个问题。
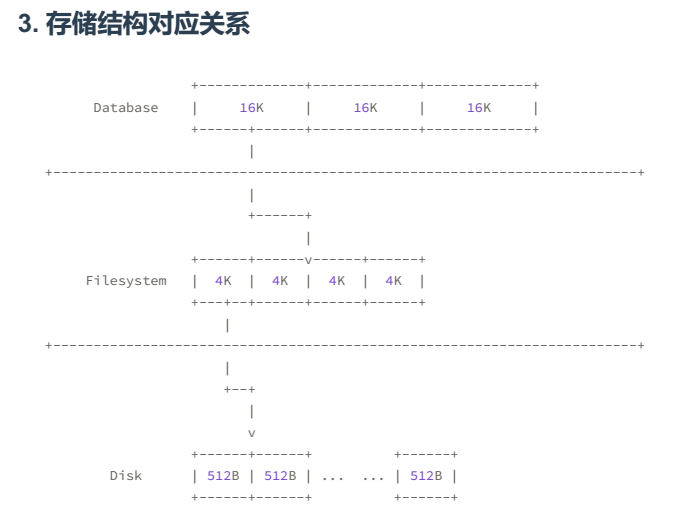
SSD扇区的大小一般为4K或者8K,但是为了兼容HDD,SSD通过Flash Translation layer(FTL)的方式转换成512B
4.O_DIRECT
fwrite / fsync
fwrite 是把数据写入文件系统层(Filesystem),(可能有cache),并不能保证写入存储。
fsync 可以保证把数据刷新到存储里。(数据落盘)
只通过fwrite写入数据特别快(因为有缓存),但随后调用fsync就会很慢,这个速度取决于磁盘的IOPS
如果不手工执行fsync,OS操作系统自己去控制的。当filesystem的cache使用到操作系统缓存的10%时,操作系统才会将数据刷入磁盘。所以可能存在数据丢失的风险,比如断电。
数据库里面每一次fwrite都会使用fsync,来保证数据的安全。
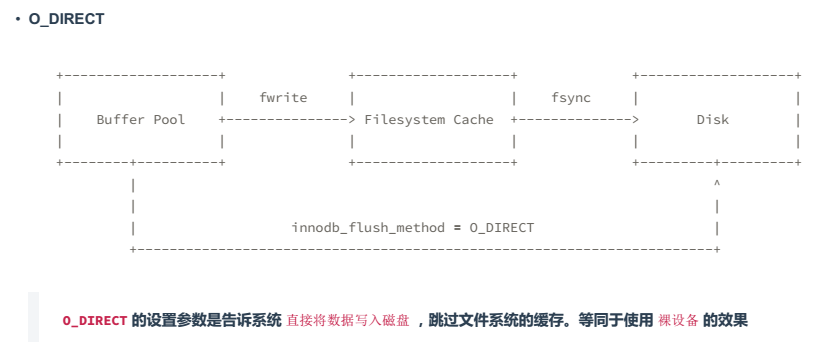
重做日志:如果开启O_DIRECT进行重做日志的话,性能会下降的。 所以不要打开O_DIRECT这个选项。
四、sysbench
1.安装
[root@localhost ~]# git clone https://github.com/akopytov/sysbench.git
[root@localhost ~]# cd sysbench
[root@localhost ~]# ./autogen.sh
[root@localhost ~]# ./configure --with-mysql-includes=/usr/local/mysql/include/ --with-mysql-libs=/usr/local/mysql/lib/
[root@localhost ~]# make
[root@localhost ~]# make install
[root@localhost ~]# echo "export LD_LIBRARY_PATH=/usr/local/mysql/lib/:$LD_LIBRARY_PATH" >> ./.bashrc
[root@localhost ~]# source .bashrc
[root@localhost ~]# sysbench --version
sysbench 1.1.0-dcf0275
2.测试
生成测试文件
[root@localhost ~]# sysbench --test=fileio \ ##File IO测试
> --file-num=4 \ ##测试文件数是4个
> --file-block-size=16384 \ ##block size是16k
> --file-total-size=100G \ ##4个文件的总大小是100G
> --file-test-mode=rndrd \ ##测试方法是随机读
> --file-extra-flags=direct \ ##direct io,跳过缓存
> --max-requests=0 \ ##一共发起多少请求,0表示任意请求
> --max-time=3600 \ ##测试3600s
> --num-threads=4 \ ##使用4个线程
> prepare # run or cleanup ##prepare:生成文件
##run:开始测试
##cleanup:删除测试文件
[root@localhost ~]# sysbench --test=fileio \
--file-num=4 \
--file-block-size=16384 \
--file-total-size=2G \
--file-test-mode=rndrd \
--file-extra-flags=direct \
--max-requests=0 \
--max-time=300 \
--num-threads=4 \
prepare
WARNING: the --test option is deprecated. You can pass a script name or path on the command line without any options.
WARNING: --num-threads is deprecated, use --threads instead
WARNING: --max-time is deprecated, use --time instead
sysbench 1.1.0-dcf0275 (using bundled LuaJIT 2.1.0-beta3)
4 files, 524288Kb each, 2048Mb total
Creating files for the test...
Extra file open flags: 3
Extending existing file test_file.0
Creating file test_file.1
Creating file test_file.2
Creating file test_file.3
2018525184 bytes written in 72.13 seconds (26.69 MiB/sec).
#######注意########
因为要测试的是在数据库的写能力,所以一定要看查看数据库的页的大小。在根据页的大小来测试。
mysql> show variables like "innodb_page_size";
+------------------+-------+
| Variable_name | Value |
+------------------+-------+
| innodb_page_size | 8192 |
+------------------+-------+
1 row in set (0.22 sec)
[root@localhost ~]# sysbench --test=fileio help
WARNING: the --test option is deprecated. You can pass a script name or path on the command line without any options.
sysbench 1.1.0-dcf0275 (using bundled LuaJIT 2.1.0-beta3)
1. fileio options:
2. --file-num=N number of files to create [128]
3. --file-block-size=N block size to use in all IO operations [16384]
4. --file-total-size=SIZE total size of files to create [2G]
5. --file-test-mode=STRING test mode {seqwr, seqrewr, seqrd, rndrd, rndwr, rndrw}
6. --file-io-mode=STRING file operations mode {sync,async,mmap} [sync]
7. --file-async-backlog=N number of asynchronous operatons to queue per thread [128]
8. --file-extra-flags=STRING additional flags to use on opening files {sync,dsync,direct} []
9. --file-fsync-freq=N do fsync() after this number of requests (0 - don't use fsync()) [100]
10. --file-fsync-all[=on|off] do fsync() after each write operation [off]
11. --file-fsync-end[=on|off] do fsync() at the end of test [on]
12. --file-fsync-mode=STRING which method to use for synchronization {fsync, fdatasync} [fsync]
13. --file-merged-requests=N merge at most this number of IO requests if possible (0 - don't merge) [0]
14. --file-rw-ratio=N reads/writes ratio for combined test [1.5]
--file-num=N 创建测试文件数量,默认是 [128]
--file-block-size=N 测试时文件块大小,默认是[16384],即16K
--file-total-size=SIZE 测试文件的总大小,默认是 [2G]
--file-test-mode=STRING 测试模式 {seqwr(顺序写), seqrewr(顺序读写), seqrd(顺序读), rndrd(随机读), rndwr(随机写), rndrw(随机读写)}
--file-io-mode=STRING 文件操作模式{sync,async,mmap} [sync]
--file-extra-flags=STRING 使用额外的标志打开文件 {sync,dsync,direct} []
--file-fsync-freq=N 执行fsync()频率,0表示不使用,默认100
--file-fsync-all=[on|off] 每执行一次写操作执行一次fsync(),默认 [off]
--file-fsync-end=[on|off] 测试结束执行fsync(),默认 [on]
--file-fsync-mode=STRING 同步方法 {fsync, fdatasync} [fsync]
--file-merged-requests=N 如果可以,则合并IO请求数,默认0表示不合并
--file-rw-ratio=N 测试读写比例,默认[1.5] ,即读写比例 3:2
seqwr 顺序写入
seqrewr 顺序重写
seqrd 顺序读取
rndrd 随机读取
rndwr 随机写入
rndrw 混合随机读/写
开始测试
sysbench --test=fileio \
--file-num=4 \
--file-block-size=8k \
--file-total-size=1G \
--file-test-mode=rndrd \
--file-extra-flags=direct \
--max-requests=0 \
--max-time=30 \ ###简单测试,测试30秒
--num-threads=4 \
--report-interval=3 \ ###每3秒产生报告
run
WARNING: the --test option is deprecated. You can pass a script name or path on the command line without any options.
WARNING: --num-threads is deprecated, use --threads instead
WARNING: --max-time is deprecated, use --time instead
sysbench 1.1.0-dcf0275 (using bundled LuaJIT 2.1.0-beta3)
Running the test with following options:
Number of threads: 4
Report intermediate results every 3 second(s)
Initializing random number generator from current time
Extra file open flags: 3
4 files, 256MiB each
1GiB total file size
Block size 8KiB
Number of IO requests: 0
Read/Write ratio for combined random IO test: 1.50
Periodic FSYNC enabled, calling fsync() each 100 requests.
Calling fsync() at the end of test, Enabled.
Using synchronous I/O mode
Doing random read test
Initializing worker threads...
Threads started!
[ 3s ] reads: 0.27 MiB/s writes: 0.00 MiB/s fsyncs: 0.00/s latency (ms,95%): 196.894
[ 6s ] reads: 1.10 MiB/s writes: 0.00 MiB/s fsyncs: 0.00/s latency (ms,95%): 292.601
[ 9s ] reads: 0.51 MiB/s writes: 0.00 MiB/s fsyncs: 0.00/s latency (ms,95%): 142.387
[ 12s ] reads: 0.49 MiB/s writes: 0.00 MiB/s fsyncs: 0.00/s latency (ms,95%): 158.632
[ 15s ] reads: 0.51 MiB/s writes: 0.00 MiB/s fsyncs: 0.00/s latency (ms,95%): 158.632
[ 18s ] reads: 0.44 MiB/s writes: 0.00 MiB/s fsyncs: 0.00/s latency (ms,95%): 215.443
[ 21s ] reads: 0.45 MiB/s writes: 0.00 MiB/s fsyncs: 0.00/s latency (ms,95%): 176.731
[ 24s ] reads: 0.49 MiB/s writes: 0.00 MiB/s fsyncs: 0.00/s latency (ms,95%): 183.211
[ 27s ] reads: 0.50 MiB/s writes: 0.00 MiB/s fsyncs: 0.00/s latency (ms,95%): 147.608
[ 30s ] reads: 0.45 MiB/s writes: 0.00 MiB/s fsyncs: 0.00/s latency (ms,95%): 193.380
Throughput:
read: IOPS=58.37 0.46 MiB/s (0.48 MB/s)
write: IOPS=0.00 0.00 MiB/s (0.00 MB/s)
fsync: IOPS=0.00
Latency (ms):
min: 6.95
avg: 68.18
max: 593.60
95th percentile: 183.21
sum: 119787.46
上述测试随机读的速度在0.48MB/S 左右,
(0.46MB/s * 1024 / 8KB = 58.88) 换算后得到的值58.88就是IOPS值,越等于上面的58.37。
测试完成后执行cleanup
如果是真实的测试 max-time设置成一周的时间
run期间可以使用iotop或者iostat进行观察
先生成测试文件,然后进行测试,测试完成后要通过cleanup删除文件。

 浙公网安备 33010602011771号