
机器学习优化算法之爬山算法小结
简言
机器学习的项目,不可避免的需要补充一些优化算法,对于优化算法,爬山算法还是比较重要的.鉴于此,花了些时间仔细阅读了些爬山算法的paper.基于这些,做一些总结.
目录
1. 爬山算法简单描述
2. 爬山算法的主要算法
2.1 首选爬山算法
2.2 最陡爬山算法
2.3 随机重新开始爬山算法
2.4 模拟退火算法(也是爬山算法)
3. 实例求解
正文
爬山算法,是一种局部贪心的最优算法. 该算法的主要思想是:每次拿相邻点与当前点进行比对,取两者中较优者,作为爬坡的下一步.
举一个例子,求解下面表达式
 的最大值. 且假设 x,y均按为0.1间隔递增.
为了更好的描述,我们先使用pyhton画出该函数的图像:
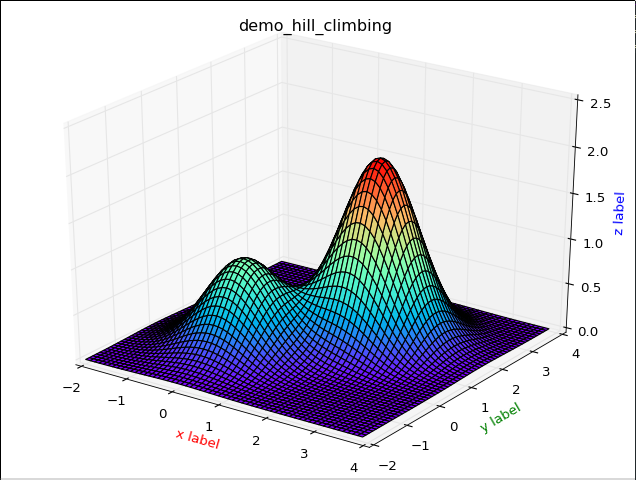
图像的python代码:


 1 # encoding:utf8
 2 from matplotlib import pyplot as plt
 3 import numpy as np
 4 from mpl_toolkits.mplot3d import Axes3D
 5
 6
 7 def func(X, Y, x_move=0, y_move=0):
 8     def mul(X, Y, alis=1):
 9         return alis * np.exp(-(X * X + Y * Y))
10
11     return mul(X, Y) + mul(X - x_move, Y - y_move, 2)
12
13
14 def show(X, Y):
15     fig = plt.figure()
16     ax = Axes3D(fig)
17     X, Y = np.meshgrid(X, Y)
18     Z = func(X, Y, 1.7, 1.7)
19     plt.title("demo_hill_climbing")
20     ax.plot_surface(X, Y, Z, rstride=1, cstride=1, cmap='rainbow', )
21     ax.set_xlabel('x label', color='r')
22     ax.set_ylabel('y label', color='g')
23     ax.set_zlabel('z label', color='b')
24     # 具体函数方法可用 help(function) 查看,如:help(ax.plot_surface)
25     # ax.scatter(X,Y,Z,c='r') #绘点
26     plt.show()
27
28 if __name__ == '__main__':
29     X = np.arange(-2, 4, 0.1)
30     Y = np.arange(-2, 4, 0.1)
31
32     show(X,Y)
对于上面这个问题,我们使用爬山算法该如何求解呢? 下面我们从爬山算法中的几种方式分别求解一下这个小题.
1. 首选爬山算法
依次寻找该点X的邻近点中首次出现的比点X价值高的点,并将该点作为爬山的点(此处说的价值高,在该题中是指Z或f(x,y)值较大). 依次循环,直至该点的邻近点中不再有比其大的点. 我们成为该点就是山的顶点,又称为最优点.
那么解题思路就有:
1. 随机选择一个登山的起点S(x0,y0,z0),并以此为起点开始登山.直至"登顶".
下面是我们实现的代码:
 1 # encoding:utf8
 2 from random import random, randint
 3
 4 from matplotlib import pyplot as plt
 5 import numpy as np
 6 from mpl_toolkits.mplot3d import Axes3D
 7
 8
 9 def func(X, Y, x_move=1.7, y_move=1.7):
10     def mul(X, Y, alis=1):
11         return alis * np.exp(-(X * X + Y * Y))
12
13     return mul(X, Y) + mul(X - x_move, Y - y_move, 2)
14
15
16 def show(X, Y, Z):
17     fig = plt.figure()
18     ax = Axes3D(fig)
19     plt.title("demo_hill_climbing")
20     ax.plot_surface(X, Y, Z, rstride=1, cstride=1, cmap='rainbow', )
21     ax.set_xlabel('x label', color='r')
22     ax.set_ylabel('y label', color='g')
23     ax.set_zlabel('z label', color='b')
24     # ax.scatter(X,Y,Z,c='r') #绘点
25     plt.show()
26
27
28 def drawPaht(X, Y, Z,px,py,pz):
29     fig = plt.figure()
30     ax = Axes3D(fig)
31     plt.title("demo_hill_climbing")
32     ax.plot_surface(X, Y, Z, rstride=1, cstride=1, cmap='rainbow', )
33     ax.set_xlabel('x label', color='r')
34     ax.set_ylabel('y label', color='g')
35     ax.set_zlabel('z label', color='b')
36     ax.plot(px,py,pz,'r.') #绘点
37     plt.show()
38
39
40 def hill_climb(X, Y):
41     global_X = []
42     global_Y = []
43
44     len_x = len(X)
45     len_y = len(Y)
46     # 随机登山点
47     st_x = randint(0, len_x-1)
48     st_y = randint(0, len_y-1)
49
50     def argmax(stx, sty, alisx=0, alisy=0):
51         cur = func(X[0][st_x], Y[st_y][0])
52         next = func(X[0][st_x + alisx], Y[st_y + alisy][0])
53
54         return cur < next and True or False
55
56     while (len_x > st_x >= 0) or (len_y > st_y >= 0):
57         if st_x + 1 < len_x and argmax(st_x, st_y, 1):
58             st_x += 1
59         elif st_y + 1 < len_x and argmax(st_x, st_y, 0, 1):
60             st_y += 1
61         elif st_x >= 1 and argmax(st_x, st_y, -1):
62             st_x -= 1
63         elif st_y >= 1 and argmax(st_x, st_y, 0, -1):
64             st_y -= 1
65         else:
66             break
67         global_X.append(X[0][st_x])
68         global_Y.append(Y[st_y][0])
69     return global_X, global_Y, func(X[0][st_x], Y[st_y][0])
70
71
72 if __name__ == '__main__':
73     X = np.arange(-2, 4, 0.1)
74     Y = np.arange(-2, 4, 0.1)
75     X, Y = np.meshgrid(X, Y)
76     Z = func(X, Y, 1.7, 1.7)
77     px, py, maxhill = hill_climb(X, Y)
78     print px,py,maxhill
79     drawPaht(X, Y, Z,px,py,func(np.array(px), np.array(py), 1.7, 1.7))
对比几次运行的结果:


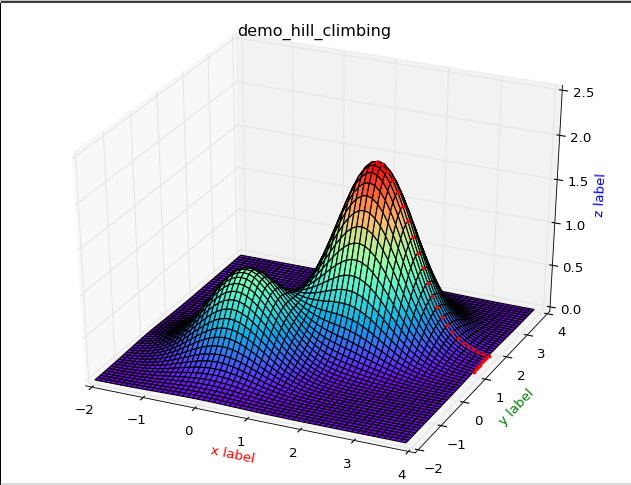

从上图中,我们可以比较清楚的观察到,首选爬山算法的缺陷.
2.那么最陡爬山算法呢?
简单描述:
最陡爬山算法是在首选爬山算法上的一种改良,它规定每次选取邻近点价值最大的那个点作为爬上的点.
下面我们来实现一下它:
 1 # encoding:utf8
 2 from random import random, randint
 3
 4 from matplotlib import pyplot as plt
 5 import numpy as np
 6 from mpl_toolkits.mplot3d import Axes3D
 7
 8
 9 def func(X, Y, x_move=1.7, y_move=1.7):
10     def mul(X, Y, alis=1):
11         return alis * np.exp(-(X * X + Y * Y))
12
13     return mul(X, Y) + mul(X - x_move, Y - y_move, 2)
14
15
16 def show(X, Y, Z):
17     fig = plt.figure()
18     ax = Axes3D(fig)
19     plt.title("demo_hill_climbing")
20     ax.plot_surface(X, Y, Z, rstride=1, cstride=1, cmap='rainbow', )
21     ax.set_xlabel('x label', color='r')
22     ax.set_ylabel('y label', color='g')
23     ax.set_zlabel('z label', color='b')
24     # ax.scatter(X,Y,Z,c='r') #绘点
25     plt.show()
26
27
28 def drawPaht(X, Y, Z, px, py, pz):
29     fig = plt.figure()
30     ax = Axes3D(fig)
31     plt.title("demo_hill_climbing")
32     ax.plot_surface(X, Y, Z, rstride=1, cstride=1, cmap='rainbow', )
33     ax.set_xlabel('x label', color='r')
34     ax.set_ylabel('y label', color='g')
35     ax.set_zlabel('z label', color='b')
36     ax.plot(px, py, pz, 'r.')  # 绘点
37     plt.show()
38
39
40 def hill_climb(X, Y):
41     global_X = []
42     global_Y = []
43
44     len_x = len(X)
45     len_y = len(Y)
46     # 随机登山点
47     st_x = randint(0, len_x - 1)
48     st_y = randint(0, len_y - 1)
49
50     def argmax(stx, sty, alisx, alisy):
51         cur = func(X[0][stx], Y[sty][0])
52         next = func(X[0][alisx], Y[alisy][0])
53         if cur < next:
54             return alisx, alisy
55         return stx, sty
56         #return cur < next and alisx, alisy or stx, sty
57
58     tmp_x = st_x
59     tmp_y = st_y
60     while (len_x > st_x >= 0) or (len_y > st_y >= 0):
61         if st_x + 1 < len_x:
62             tmp_x, tmp_y = argmax(tmp_x, tmp_y, (st_x + 1), st_y)
63
64         if st_x >= 1:
65             tmp_x, tmp_y = argmax(tmp_x, tmp_y, st_x - 1, st_y)
66
67         if st_y + 1 < len_x:
68             tmp_x, tmp_y = argmax(tmp_x, tmp_y, st_x, st_y + 1)
69
70         if st_y >= 1:
71             tmp_x, tmp_y = argmax(tmp_x, tmp_y, st_x, st_y - 1)
72
73         if tmp_x != st_x or tmp_y != st_y:
74             st_x = tmp_x
75             st_y = tmp_y
76         else:
77             break
78         global_X.append(X[0][st_x])
79         global_Y.append(Y[st_y][0])
80     return global_X, global_Y, func(X[0][st_x], Y[st_y][0])
81
82
83 if __name__ == '__main__':
84     X = np.arange(-2, 4, 0.1)
85     Y = np.arange(-2, 4, 0.1)
86     X, Y = np.meshgrid(X, Y)
87     Z = func(X, Y, 1.7, 1.7)
88     px, py, maxhill = hill_climb(X, Y)
89     print px, py, maxhill
90     drawPaht(X, Y, Z, px, py, func(np.array(px), np.array(py), 1.7, 1.7))


从这个结果来看,因为范围扩大了一点,所以效果会好一点点,当依旧是一个局部最优算法.
3.随机重新开始爬山算法呢?
简单的描述:
随机重新开始爬山算法是基于最陡爬山算法,其实就是加一个达到全局最优解的条件,如果满足该条件,就结束运算,反之则无限次重复运算最陡爬山算法.
由于此题,并没有结束的特征条件,我们这里就不给予实现.
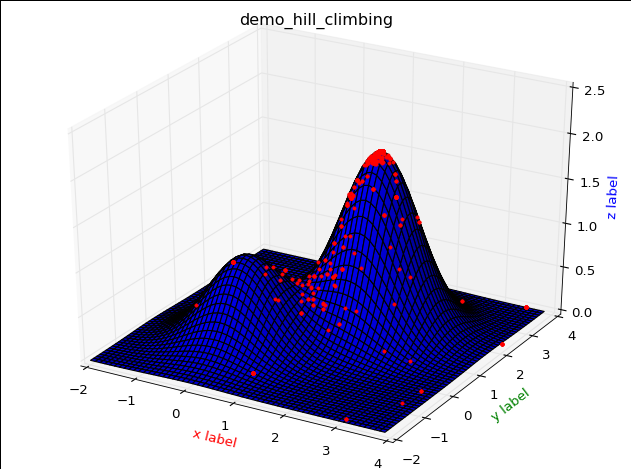
4.模拟退火算法
简单描述:
(1)随机挑选一个单元k,并给它一个随机的位移,求出系统因此而产生的能量变化ΔEk。
(2)若ΔEk⩽0,该位移可采纳,而变化后的系统状态可作为下次变化的起点;
若ΔEk>0,位移后的状态可采纳的概率为
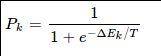
式中T为温度,然后从(0,1)区间均匀分布的随机数中挑选一个数R,若R<Pk,则将变化后的状态作为下次的起点;否则,将变化前的状态作为下次的起点。
(3)转第(1)步继续执行,知道达到平衡状态为止。
代码实现为:
 1 # encoding:utf8
 2 from random import random, randint
 3
 4 from matplotlib import pyplot as plt
 5 import numpy as np
 6 from mpl_toolkits.mplot3d import Axes3D
 7
 8
 9 def func(X, Y, x_move=1.7, y_move=1.7):
10     def mul(X, Y, alis=1):
11         return alis * np.exp(-(X * X + Y * Y))
12
13     return mul(X, Y) + mul(X - x_move, Y - y_move, 2)
14
15
16 def show(X, Y, Z):
17     fig = plt.figure()
18     ax = Axes3D(fig)
19     plt.title("demo_hill_climbing")
20     ax.plot_surface(X, Y, Z, rstride=1, cstride=1, cmap='rainbow', )
21     ax.set_xlabel('x label', color='r')
22     ax.set_ylabel('y label', color='g')
23     ax.set_zlabel('z label', color='b')
24     # ax.scatter(X,Y,Z,c='r') #绘点
25     plt.show()
26
27
28 def drawPaht(X, Y, Z, px, py, pz):
29     fig = plt.figure()
30     ax = Axes3D(fig)
31     plt.title("demo_hill_climbing")
32     ax.plot_surface(X, Y, Z, rstride=1, cstride=1, color='b' )
33     ax.set_xlabel('x label', color='r')
34     ax.set_ylabel('y label', color='g')
35     ax.set_zlabel('z label', color='b')
36     ax.plot(px, py, pz, 'r.')  # 绘点
37     plt.show()
38
39
40 def hill_climb(X, Y):
41     global_X = []
42     global_Y = []
43     # 初始温度
44     temperature = 105.5
45     # 温度下降的比率
46     delta = 0.98
47     # 温度精确度
48     tmin = 1e-10
49
50     len_x = len(X)
51     len_y = len(Y)
52
53     # 随机登山点
54     st_x = X[0][randint(0, len_x - 1)]
55     st_y = Y[randint(0, len_y - 1)][0]
56     st_z = func(st_x, st_y)
57
58     def argmax(stx, sty, alisx, alisy):
59         cur = func(st_x, st_y)
60         next = func(alisx, alisy)
61
62         return cur < next and True or False
63
64     while (temperature > tmin):
65         # 随机产生一个新的邻近点
66         # 说明: 温度越高幅度邻近点跳跃的幅度越大
67         tmp_x = st_x + (random() * 2 - 1) * temperature
68         tmp_y = st_y + + (random() * 2 - 1) * temperature
69         if 4 > tmp_x >= -2 and 4 > tmp_y >= -2:
70             if argmax(st_x, st_y, tmp_x, tmp_y):
71                 st_x = tmp_x
72                 st_y = tmp_y
73             else:  # 有机会跳出局域最优解
74                 pp = 1.0 / (1.0 + np.exp(-(func(tmp_x, tmp_y) - func(st_x, st_y)) / temperature))
75                 if random() < pp:
76                     st_x = tmp_x
77                     st_y = tmp_y
78         temperature *= delta  # 以一定的速率下降
79         global_X.append(st_x)
80         global_Y.append(st_y)
81     return global_X, global_Y, func(st_x, st_y)
82
83
84 if __name__ == '__main__':
85     X = np.arange(-2, 4, 0.1)
86     Y = np.arange(-2, 4, 0.1)
87     X, Y = np.meshgrid(X, Y)
88     Z = func(X, Y, 1.7, 1.7)
89     px, py, maxhill = hill_climb(X, Y)
90     print px, py, maxhill
91     drawPaht(X, Y, Z, px, py, func(np.array(px), np.array(py), 1.7, 1.7))
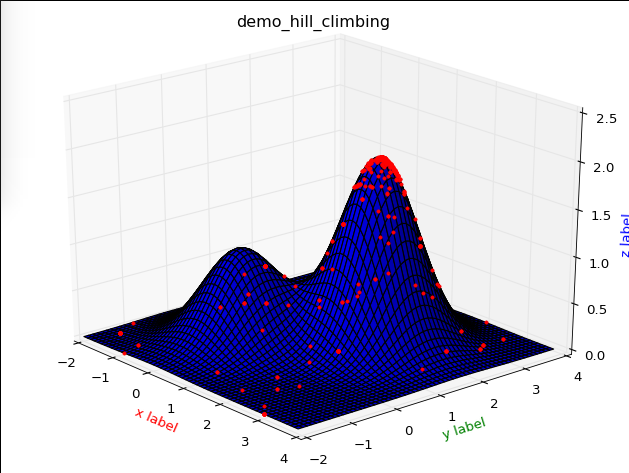
效果:


 浙公网安备 33010602011771号