
ELK--01
目录
1.ELK简介
elk的组成
E  Elasticsearch  java编写
F  filebeat 	  go编写   #注意:那台有服务那台需要装filebeat
K  kibana 	      java编写
L  logstash	      java编写

注意:java编写的服务启动慢,占用内存大
      go语言编写的服务,轻便,速度快

#filebeat工作原理
1.类似tail -f 只读取最新的日志并发给ES
2.会自动记录读取的最新行,不会重读。

2.日志分析的需求
1.找出访问排名前10的IP  所有的流量
2.找出访问排名前10的URL
3.再分析一下11点到12点之间的数据
4.对比昨天这个时间段和今天这个时间段访问频次有什么变化
5.对比上周某天某个时间段某个特定链接的流量和今天这个这个时间段链接的流量
6.找出特定页面被访问了多少次
7.找出有问题的IP
  并告诉我这个IP地址都访问了什么页面?
  对比前几天他来过吗?
  他什么时间开始攻击的?什么时间结束攻击的?
8.找出访问最慢的前10个页面
  并且统计平均响应时间
  并且对比昨天这个时间段访问也这么慢吗?
  从哪一天开始变慢的?
9.找出搜索引擎今天抓取了多少次?
  抓取了哪些页面?
  响应时间如何?
10.找出伪造成搜索引擎的IP地址
3.日志收集分类
系统层:message secure
代理层:nginx haproxy
web层:nginx php tomcat
db层: mysql redis mongo es
存储层:nfs gfs
4.准备单机环境
db01需要安装的服务  nginx filebeat es kibana es-head
db02需要安装的服务  nginx filebeat

0.需要时间同步
[root@db01 ~]# yum install -y ntpdate
#手动更新时间
ntpdate time1.aliyun.com
#编写定时任务
[root@db01 ~]# crontab -l
#时间同步
*/3 * * * * /usr/sbin/ntpdate ntpdate ntp1.aliyun.com &>/dev/null

1.es单机环境准备
[root@db01 ~]# cat >/etc/elasticsearch/elasticsearch.yml <<EOF
node.name: node-1
path.data: /var/lib/elasticsearch
path.logs: /var/log/elasticsearch
network.host: 10.0.0.51,127.0.0.1
http.port: 9200
EOF

#停掉es
[root@db01 ~]#  systemctl stop elasticsearch
#删除es的数据
[root@db01 ~]#  rm -rf /var/lib/elasticsearch/*
#删除kibana的数据
[root@db01 ~]#  rm -rf /var/lib/kibana/*
#启动es
[root@db01 ~]#  systemctl start elasticsearch
#启动kibana
[root@db01 ~]#  systemctl start kibana
#查看es的日志,确认是否后启动成功
[root@db01 ~]#  tail -f /var/log/elasticsearch/elasticsearch.log
#查看端口是否存在
[root@db01 ~]#  netstat -lntup|egrep "5601|9200"
tcp        0      0 10.0.0.51:5601          0.0.0.0:*               LISTEN      15081/node
tcp6       0      0 10.0.0.51:9200          :::*                    LISTEN      14843/java
tcp6       0      0 127.0.0.1:9200          :::*                    LISTEN      14843/java
5.filebeat收集Nginx普通格式日志 ( 在DB01安装配置 )
0.卸载es环境创建的分词器
/usr/share/elasticsearch/bin/elasticsearch-plugin remove analysis-ik --purge
systemctl restart elasticsearch.service
1.安装Nginx( 配置nginx源 )
[root@db01 ~]# cat >/etc/yum.repos.d/nginx.repo <<EOF
[nginx-stable]
name=nginx stable repo
baseurl=http://nginx.org/packages/centos/\$releasever/\$basearch/
gpgcheck=1
enabled=1
gpgkey=https://nginx.org/keys/nginx_signing.key
module_hotfixes=true
[nginx-mainline]
name=nginx mainline repo
baseurl=http://nginx.org/packages/mainline/centos/\$releasever/\$basearch/
gpgcheck=1
enabled=0
gpgkey=https://nginx.org/keys/nginx_signing.key
module_hotfixes=true
EOF
#安装nginx
[root@db01 ~]# yum install nginx -y
#重新启动nginx并加入开机自启
[root@db01 ~]# systemctl start nginx
[root@db01 ~]# systemctl enable nginx
#测试连接
[root@db01 ~]# curl 127.0.0.1
2.配置Nginx并创建测试页面
#删除默认配置文件
[root@db01 ~]# rm -rf /etc/nginx/conf.d/default.conf
#配置nginx配置文件
[root@db01 ~]# cat >/etc/nginx/conf.d/www.conf<<EOF
server {
listen 80;
server_name localhost;
location / {
root /code/www;
index index.html index.htm;
}
}
EOF
#根据配置文件创建目录
[root@db01 ~]# mkdir /code/www/ -p
#创建测试页面内容
[root@db01 ~]# echo "db01-www" > /code/www/index.html
#检查
[root@db01 ~]# nginx -t
#重启nginx
[root@db01 ~]# systemctl restart nginx
#测试连接
[root@db01 ~]# curl 127.0.0.1
#查看日志
[root@db01 ~]# tail -f /var/log/nginx/access.log
3.安装filebet
[root@db01 ~]# rpm -ivh filebeat-6.6.0-x86_64.rpm
4.配置filebeat
[root@db01 ~]# cat >/etc/filebeat/filebeat.yml<<EOF
filebeat.inputs:
- type: log
enabled: true
paths:
- /var/log/nginx/access.log
output.elasticsearch:
hosts: ["10.0.0.51:9200"]
EOF
5.启动测试
[root@db01 ~]# systemctl start filebeat
6.检查结果
[root@db01 ~]# tail -f /var/log/filebeat/filebeat
[root@db01 ~]# curl -s 127.0.0.1:9200/_cat/indices|awk '{print $3}'
7.es-head插件查看
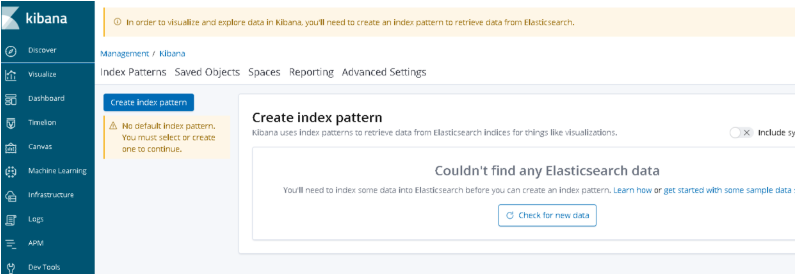
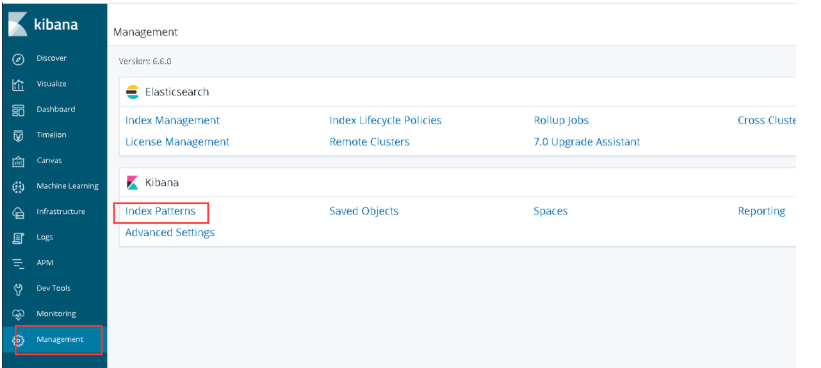
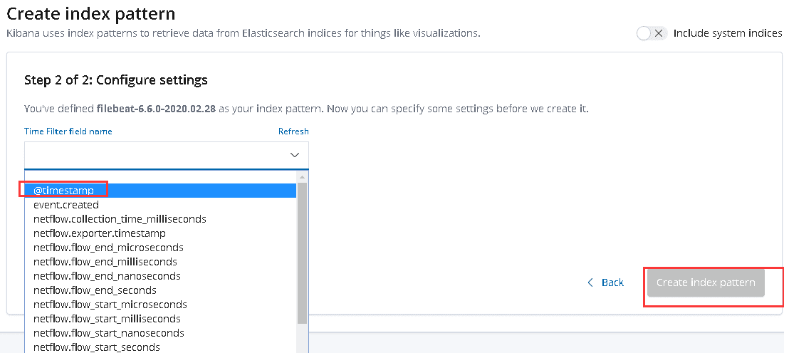
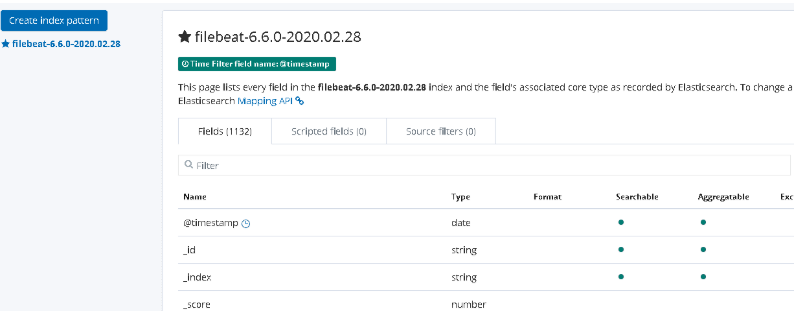
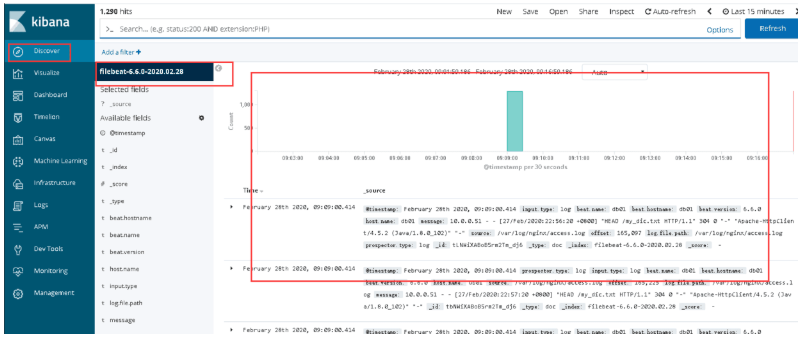
8.kibana添加索引
Management-->kibana-->Index Patterns-->filebeat-6.6.0-2020.02.13
es插件安装

kibana添加索引


6.filebeat收集Nginx的json格式日志
1.普通Nginx日志不足的地方:
- 日志都在一个value里,不能拆分单独显示和搜索
- 索引名称没有意义

2.理想中的情况
{
    $remote_addr : 192.168.12.254
    - : -
    $remote_user : -
    [$time_local]: [10/Sep/2019:10:52:08 +0800]
    $request: GET /jhdgsjfgjhshj HTTP/1.0
    $status : 404
    $body_bytes_sent : 153
    $http_referer : -
    $http_user_agent :ApacheBench/2.3
    $http_x_forwarded_for:-
}

3.目标
将Nginx日志转换成json格式

4.修改nginx配置文件使日志转换成json
log_format json '{ "time_local": "$time_local", '
                          '"remote_addr": "$remote_addr", '
                          '"referer": "$http_referer", '
                          '"request": "$request", '
                          '"status": $status, '
                          '"bytes": $body_bytes_sent, '
                          '"agent": "$http_user_agent", '
                          '"x_forwarded": "$http_x_forwarded_for", '
                          '"up_addr": "$upstream_addr",'
                          '"up_host": "$upstream_http_host",'
                          '"upstream_time": "$upstream_response_time",'
                          '"request_time": "$request_time"'
    ' }';
    access_log  /var/log/nginx/access.log  json;

#清空旧日志
[root@db01 ~]# > /var/log/nginx/access.log

#检查并重启nginx
[root@db01 ~]# nginx -t
[root@db01 ~]# systemctl restart nginx

5.修改filebeat配置文件
cat >/etc/filebeat/filebeat.yml<<EOF
filebeat.inputs:
- type: log
  enabled: true
  paths:
    - /var/log/nginx/access.log
  json.keys_under_root: true
  json.overwrite_keys: true
output.elasticsearch:
  hosts: ["10.0.0.51:9200"]
EOF

6.删除旧的ES索引
es-head >> filebeat-6.6.0-2019.11.15 >> 动作 >>删除

7.删除kibana里面的日日志信息

8.重启filebeat
[root@db01 ~]# systemctl restart filebeat

9.curl 一下nginx,并在es-head插件查看
[root@db01 ~]# curl 127.0.0.1
db01-www

7.filebeat自定义ES索引名称
1.理想中的索引名称
filebeat-6.6.0-2020.02.13
nginx-6.6.0-2019.11.15

2.filebeat配置
[root@db01 ~]# cat >/etc/filebeat/filebeat.yml<<EOF
filebeat.inputs:
- type: log
  enabled: true
  paths:
    - /var/log/nginx/access.log
  json.keys_under_root: true
  json.overwrite_keys: true

output.elasticsearch:
  hosts: ["10.0.0.51:9200"]
  index: "nginx-%{[beat.version]}-%{+yyyy.MM}"

setup.template.name: "nginx"
setup.template.pattern: "nginx-*"
setup.template.enabled: false
setup.template.overwrite: true
EOF

3.重启filebeat
[root@db01 ~]# systemctl restart filebeat

4.生成新日志并检查
[root@db01 ~]# curl 127.0.0.1

5.es-head插件查看并在中kibana添加

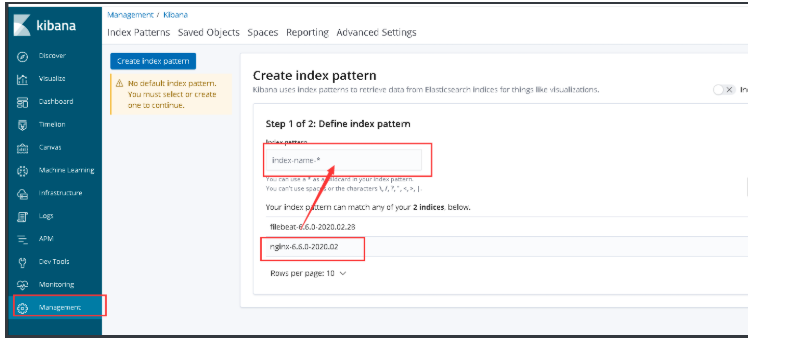
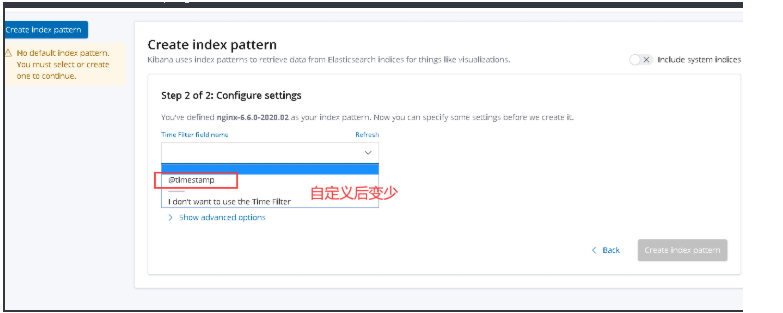
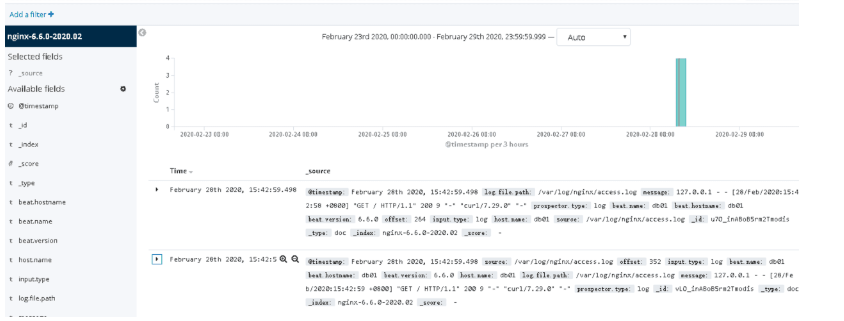
8.filebeat按照服务类型拆分索引
1.理想中的情况:
nginx-access-6.6.0-2020.02
nginx-error-6.6.0-2020.02
2.filebeat配置
#第一种方法:
[root@db01 ~]# cat >/etc/filebeat/filebeat.yml <<EOF
filebeat.inputs:
- type: log
enabled: true
paths:
- /var/log/nginx/access.log
json.keys_under_root: true
json.overwrite_keys: true
- type: log
enabled: true
paths:
- /var/log/nginx/error.log
output.elasticsearch:
hosts: ["10.0.0.51:9200"]
indices:
- index: "nginx-access-%{[beat.version]}-%{+yyyy.MM}"
when.contains:
source: "/var/log/nginx/access.log"
- index: "nginx-error-%{[beat.version]}-%{+yyyy.MM}"
when.contains:
source: "/var/log/nginx/error.log"
setup.template.name: "nginx"
setup.template.pattern: "nginx-*"
setup.template.enabled: false
setup.template.overwrite: true
EOF
#第二种方法:
[root@db01 ~]# cat >/etc/filebeat/filebeat.yml <<EOF
filebeat.inputs:
- type: log
enabled: true
paths:
- /var/log/nginx/access.log
json.keys_under_root: true
json.overwrite_keys: true
tags: ["access"]
- type: log
enabled: true
paths:
- /var/log/nginx/error.log
tags: ["error"]
output.elasticsearch:
hosts: ["10.0.0.51:9200"]
indices:
- index: "nginx-access-%{[beat.version]}-%{+yyyy.MM}"
when.contains:
tags: "access"
- index: "nginx-error-%{[beat.version]}-%{+yyyy.MM}"
when.contains:
tags: "error"
setup.template.name: "nginx"
setup.template.pattern: "nginx-*"
setup.template.enabled: false
setup.template.overwrite: true
EOF
3.重启filebeat
[root@db01 ~]# systemctl restart filebeat
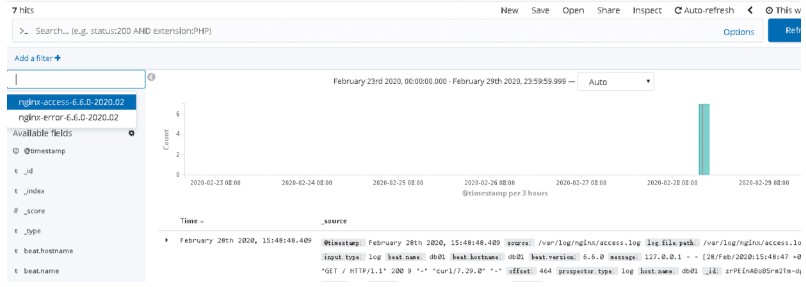
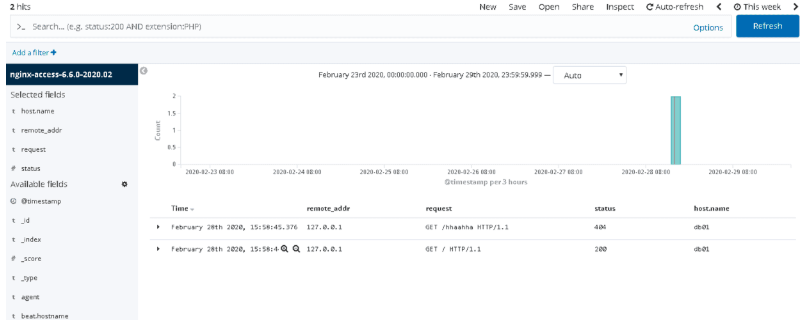
4.生成正确和错误的测试数据
[root@db01 ~]# curl 127.0.0.1/haahha
[root@db01 ~]# curl 127.0.0.1
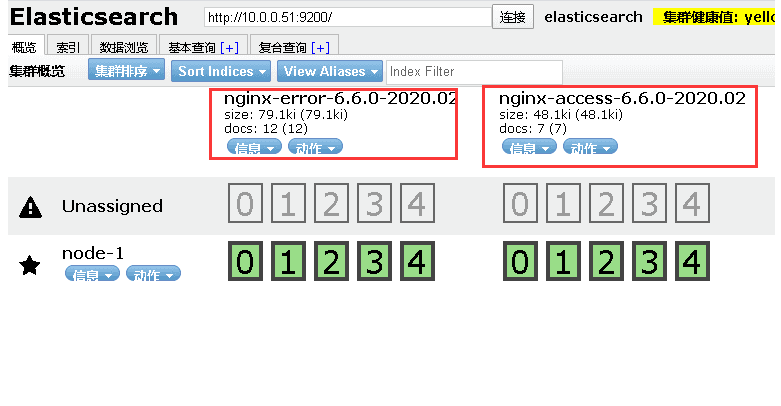
5.检查是否生成对应的索引
nginx-access-6.6.0-2020.02
nginx-error-6.6.0-2020.02


 浙公网安备 33010602011771号