

.Net Quick start for the OpenFlashChart control
.Net Quick start for the OpenFlashChart control
http://www.prestigedevgroup.com/tutorials/openflashchart/TutorialPage1.aspx
Page 2 - Add Data
With this quick start tutorial you should be able to have a test implementation in minutes. Just follow these simple steps: First download the precompiled version of the OpenFlashChart Control (modified by Prestige Development Group, LLC).
Start a new website in Visual Studio. Copy the contents that were in the quickstart folder to your new website directory. Now refresh your solution and it should look like the picture below. 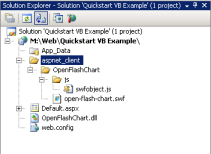
Now you will want to add the OpenFlashChart.dll to your bin folder. First add the .Net Bin folder to your solution: Right click on the project, click add ASP.Net Folder. Then Choose Bin. 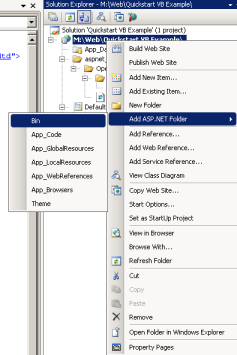
Now that you have the Bin folder, right click on it and choose -> Add existing item. You should see the OpenFlashChart.dll (if you copied it to your new solutions directory.) Your solution should now look like this: 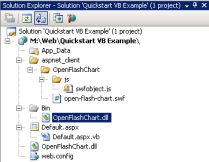
Now its time to register the control. Go to your default.aspx page and add the following:
<%@Register TagPrefix="ofc" Namespace="OpenFlashChart" Assembly="OpenFlashChart" %>
You are now ready to add the Chart control to your page. Add the following between the div Tags in your form:
<ofc:Chart ID="Chart" Height="500" Width="800" runat="server" />
Your .aspx page code should look like this: 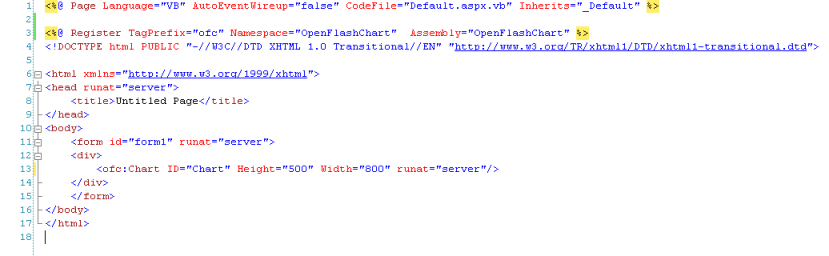
Now in your code behind you need to turn off the page caching. Go to the page load even and add: Response.CacheControl = "no-cache" 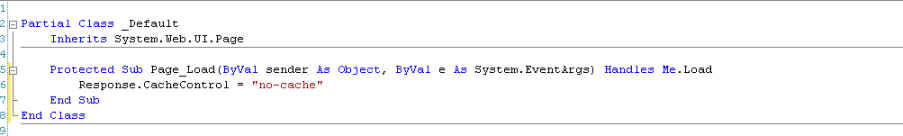
Run your solution, you should have a big empty chart show up. ![]()
You are now ready to add some data!
Page 2 - Add Data
Adding Data to the OpenFlashChart control
Page 1
To add data we need to set an attribute on the OpenFlashChart called URL. For this example I will set this attribute in the code behind: I have told the control that the data.aspx will be output sending the data for the control: 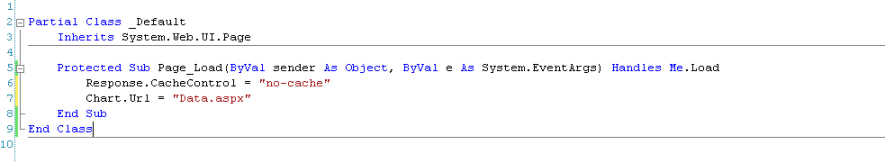
We now need to add a new page called data.aspx to the project. Enter the code behind and import OpenFlashChart. Then dim a new graph in the Page_Load, your data code behind should now look like this: 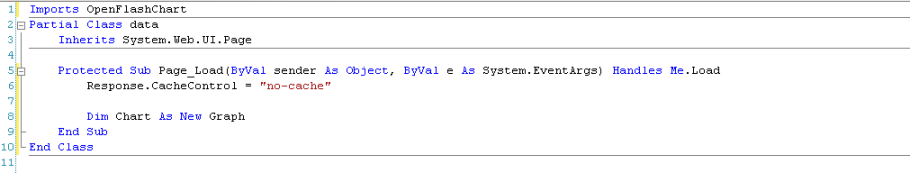
Now we will just write some static data in the code behind. 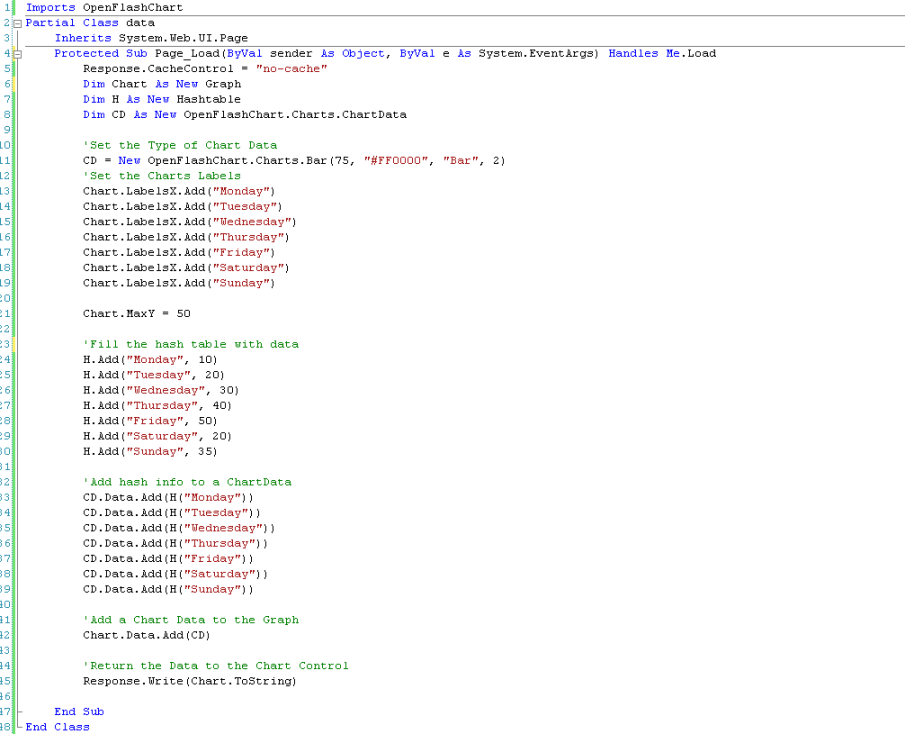
First we set the type of chart we were going to add. I set up the labels for the X axis of the chart for each day of the week. I then decided that I only wanted the Y axis to scale to 50. I used a hash table to store some static data. After the hash table was loaded, I added it to my Chart Data (which I defined earlier as a bar chart). You can add additional bars by adding additional chart data. Last I added my bar chart to the graph. 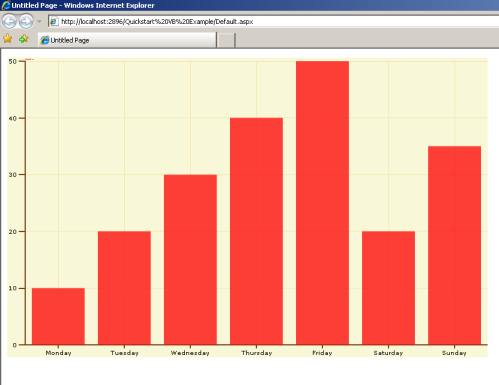
Your chart should look similar to mine. You now can experiment with changing all kinds of attributes of the chart or adding additional data to the chart.
Page 1

 浙公网安备 33010602011771号