


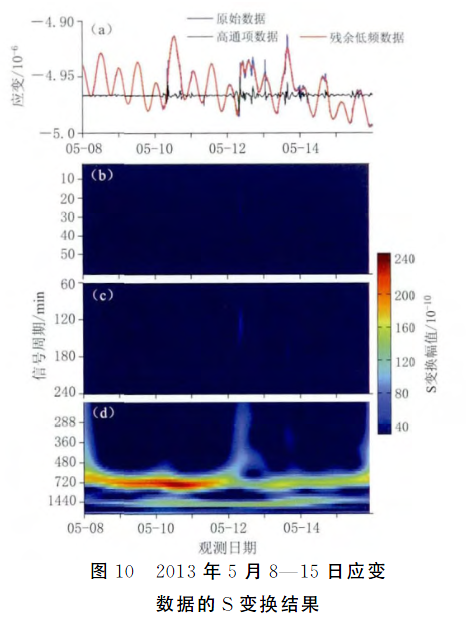
S变换画图
The S -transform with windows of arbitrary
and varying shape

想画如上的三张图,可是问题
(1)滤波窗口的平滑实现
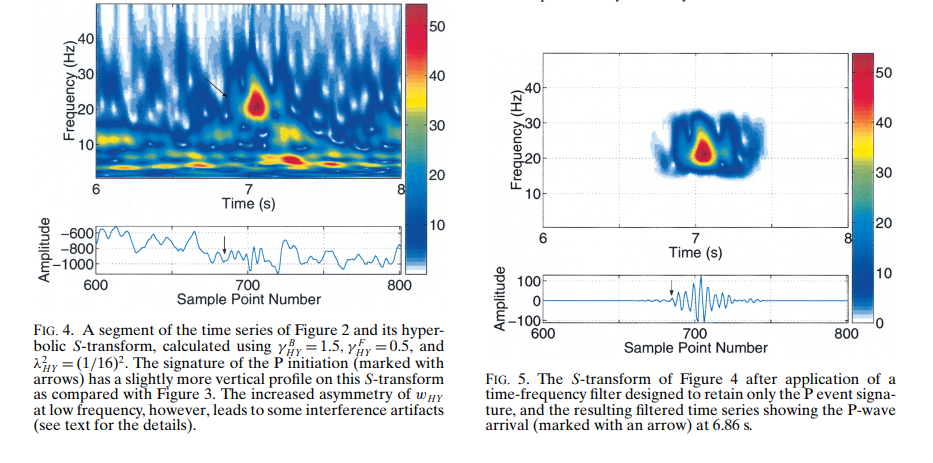
The filter (applied to the full 200£400 S-transform matrix)
is constructed in Matlab by constructing a two-dimensional
“boxcar”, using
filter = zeros(200,400);
filter(69:128,180:240)=1;
The filter edges are then smoothed by setting the value of
each pixel equal to the average of its four adjacent pixels (this
procedure is repeated 100 times).
(2)S变换中的频率与短时傅里叶变换频率怎么对应
我画出来的频率不太对。。边缘也还没处理。。
clear all
% x1=readEIS('35006_6_2121_秒.txt');
% x=x1(:,2);
x1=load('qzh_3.txt');
% x=qzh_3;

points=length(x1);
figure
subplot(211),plot(0:0.02:0.02*(points-1),x1);title('原始信号');grid on;


 [st_matrix,st_times,st_frequencies] = st(x1) ;
%  imagesc(st_times,st_frequencies,abs(st_matrix))
% imcontour(abs(st_matrix))
ST=abs(st_matrix);
filter = zeros(1501,3000);
filter(100:800,900:1400)=1;
STF=ST.*filter;
STF(STF==0) = NaN;
subplot(212),h=imagesc(STF);%其中C为包含有nan的数据
set(h,'alphadata',~isnan(STF))
ylim([0 1000])
% set(gca, 'ydir', 'reverse');
colorbar
colormapeditor


 浙公网安备 33010602011771号