计算非中心 t 分布的累积分布函数——基于 LLM 的 Excel VBA 实现
微信群中发现有对数理统计中单样本 T 检验功效值计算的讨论,在 R 语言中 1-pt(qt(0.975,8),8,-1.571428571)+pt(-qt(0.975,8),8,-1.571428571) 得到 0.2834242。
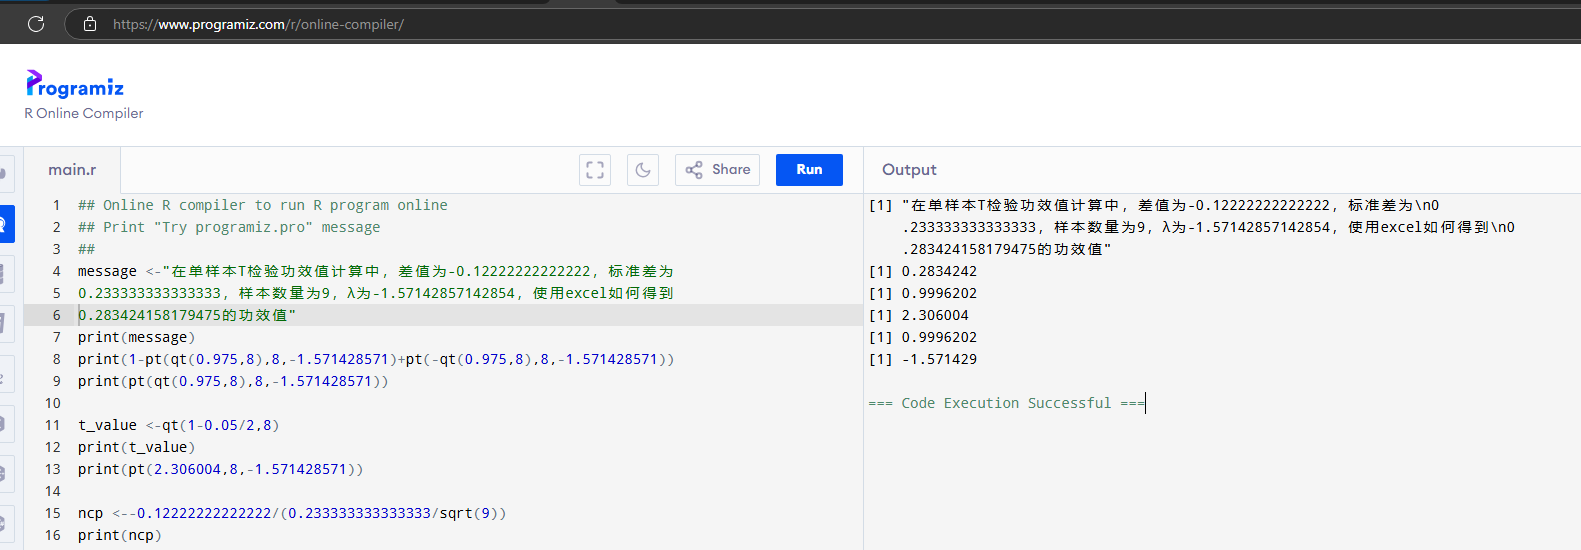
计算功效过程中用到了的非中心 t 分布,而 excel 原生没有对其支持,需要写自定义函数,
询问大模型及信息检索有如下的代码——
deepseek 等大模型的回答免不了幻觉。下图是 microsoft copilot中的回复

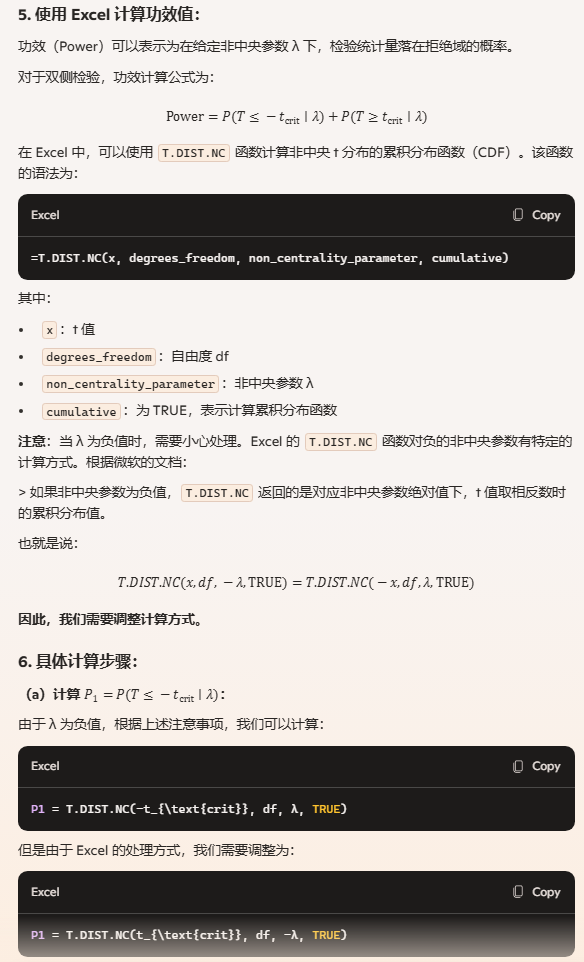


excel 中 T.DIST.NC 函数是不存在的。
使用多个大语言模型及传统搜索引擎,有如下结果
其一、
Function NonCentralTCDF(x As Double, df As Double, ncp As Double) As Double
    ' 基于AS 243算法实现非中心t分布的CDF
    Dim eps As Double, iterMax As Integer
    eps = 0.0000001: iterMax = 1000
    Dim sum As Double, term As Double, lam2 As Double, pois As Double
    Dim k As Integer, t As Double, beta As Double
    Dim a As Double, b As Double

    If df <= 0 Then
        NonCentralTCDF = CVErr(xlErrValue)
        Exit Function
    End If

    If x < 0 Then
        NonCentralTCDF = 1 - NonCentralTCDF(-x, df, -ncp)
        Exit Function
    End If

    t = x / Sqr(df + x * x)
    lam2 = ncp * ncp
    sum = 0
    term = 0
    k = 0

    Do
        a = 0.5 * lam2
        ' 计算泊松概率:exp(-a) * a^k / k!
        If k = 0 Then
            pois = Exp(-a)
        Else
            pois = pois * a / k
        End If
        beta = Application.BetaDist(t * t, k + 0.5, df / 2)
        term = pois * beta
        sum = sum + term
        k = k + 1
    Loop While (term > eps * sum) And (k <= iterMax)

    sum = sum + Exp(-0.5 * lam2) * Application.Norm_S_Dist(-ncp, True)
    NonCentralTCDF = sum
End Function
又一
Public Function NonCentralT_CDF(t As Double, df As Double, ncp As Double) As Double
    Dim a As Double, b As Double
    Dim x As Double
    Dim sum As Double, term As Double
    Dim k As Integer
    Const MAX_ITER As Integer = 1000
    Const EPS As Double = 0.000000000001
    Dim lambda As Double

    If df <= 0 Then
        NonCentralT_CDF = CVErr(xlErrNum)
        Exit Function
    End If

    lambda = ncp
    a = df / 2
    b = 0.5
    x = df / (df + t * t)

    ' 初始项
    term = Exp(-0.5 * lambda * lambda)
    sum = term * IncompleteBeta(x, a, b)

    ' 迭代计算
    k = 1
    Do While k < MAX_ITER
        term = term * (lambda * lambda / (2 * k))
        Dim temp As Double
        temp = term * IncompleteBeta(x, a + k, b)
        sum = sum + temp
        If temp < EPS * sum Then Exit Do
        k = k + 1
    Loop

    If t >= 0 Then
        NonCentralT_CDF = 1 - 0.5 * sum
    Else
        NonCentralT_CDF = 0.5 * sum
    End If
End Function

' 不完全贝塔函数
Private Function IncompleteBeta(x As Double, a As Double, b As Double) As Double
    Dim bt As Double
    If x = 0 Or x = 1 Then
        bt = 0
    Else
        bt = Exp(GammaLn(a + b) - GammaLn(a) - GammaLn(b) + a * Log(x) + b * Log(1 - x))
    End If

    If x < (a + 1) / (a + b + 2) Then
        IncompleteBeta = bt * BetaCF(x, a, b) / a
    Else
        IncompleteBeta = 1 - bt * BetaCF(1 - x, b, a) / b
    End If
End Function

' 贝塔函数的连分式展开
Private Function BetaCF(x As Double, a As Double, b As Double) As Double
    Const MAX_ITER As Integer = 200
    Const EPS As Double = 0.0000003
    Dim m As Integer
    Dim aa As Double
    Dim c As Double
    Dim d As Double
    Dim h As Double
    Dim del As Double

    c = 1
    d = 1 - (a + b) * x / (a + 1)
    If Abs(d) < 1E-30 Then d = 1E-30
    d = 1 / d
    h = d

    For m = 1 To MAX_ITER
        Dim m2 As Integer
        m2 = 2 * m

        ' 偶数步骤
        aa = m * (b - m) * x / ((a + m2 - 1) * (a + m2))
        d = 1 + aa * d
        If Abs(d) < 1E-30 Then d = 1E-30
        c = 1 + aa / c
        If Abs(c) < 1E-30 Then c = 1E-30
        d = 1 / d
        h = h * d * c

        ' 奇数步骤
        aa = -(a + m) * (a + b + m) * x / ((a + m2) * (a + m2 + 1))
        d = 1 + aa * d
        If Abs(d) < 1E-30 Then d = 1E-30
        c = 1 + aa / c
        If Abs(c) < 1E-30 Then c = 1E-30
        d = 1 / d
        del = d * c
        h = h * del

        If Abs(del - 1) < EPS Then Exit For
    Next m

    BetaCF = h
End Function

' 计算伽马函数的对数
Private Function GammaLn(xx As Double) As Double
    Dim cof As Variant
    cof = Array(76.1800917294715, -86.5053203294168, _
                24.0140982408309, -1.23173957245015, _
                1.20865097386618E-03, -5.395239384953E-06)
    Dim x As Double, y As Double, tmp As Double, ser As Double
    Dim j As Integer

    x = xx - 1
    y = x
    tmp = x + 5.5
    tmp = tmp - (x + 0.5) * Log(tmp)
    ser = 1.00000000019001

    For j = 0 To UBound(cof)
        x = x + 1
        ser = ser + cof(j) / x
    Next j

    GammaLn = -tmp + Log(2.506628274631 * ser)
End Function
其二、
Function NonCentralTCDF2(t As Double, df As Double, ncp As Double, _
    Optional maxIterations As Long = 1000, Optional precision As Double = 0.000000000001) As Double
'================================================================================
' 函数名称:NonCentralTCDF2
' 功能描述:计算非中心t分布的累积分布函数(Cumulative Distribution Function)
'--------------------------------------------------------------------------------
' 参数说明:
'   t     : 分位数值(可正可负)
'   df    : 自由度(必须为正整数)
'   ncp   : 非中心参数(表示分布偏移量)
'   maxIterations : 最大迭代次数(默认1000次)
'   precision    : 收敛精度(默认1e-12)
'--------------------------------------------------------------------------------
' 返回值:
'   返回概率值 P(T ≤ t),其中T服从非中心t分布
'--------------------------------------------------------------------------------
' 算法原理:
'   基于Lentz算法优化的级数展开法,核心公式:
'   P(T ≤ t) = Σ [e^(-λ/2)*(λ/2)^k / k!] * I_r(k+0.5, df/2) + 修正项
'   其中:
'     λ = ncp2/2
'     r = t2/(t2 + df)
'     I_x(a,b)为不完全Beta函数
'================================================================================

    ' ============== 参数预处理 ==============
    ' 处理自由度无效的情况
    If df <= 0 Or df <> Int(df) Then
        NonCentralTCDF2 = CVErr(xlErrValue)
        Exit Function
    End If

    ' 处理t为负的情况(利用非中心t分布的对称性)
    If t < 0 Then
        ' 对称公式:P(T ≤ t | ncp) = 1 - P(T ≤ -t | -ncp)
        NonCentralTCDF2 = 1 - NonCentralTCDF2(-t, df, -ncp, maxIterations, precision)
        Exit Function
    End If

    ' ============== 计算准备 ==============
    Dim lambda As Double   ' 泊松分布参数λ = ncp2/2
    Dim r As Double        ' Beta分布参数r = t2/(t2 + df)
    Dim iterCount As Long  ' 实际迭代次数计数器
    Dim sumP As Double     ' 累计概率和
    Dim remainP As Double  ' 剩余未计算概率
    Dim term As Double     ' 当前项的计算值

    lambda = ncp ^ 2 / 2
    r = t ^ 2 / (t ^ 2 + df)
    sumP = 0
    remainP = 1  ' 初始总概率为1

    ' ============== 级数展开计算 ==============
    ' 从泊松分布的均值点向两侧展开计算
    Dim baseIndex As Long
    baseIndex = Int(lambda)  ' 泊松分布概率最大的位置

    ' 向下计算(baseIndex, baseIndex-1,...)
    Dim downIndex As Long
    downIndex = baseIndex

    ' 向上计算(baseIndex+1, baseIndex+2,...)
    Dim upIndex As Long
    upIndex = baseIndex + 1

    With Application.WorksheetFunction
        Do While iterCount < maxIterations And remainP > precision
            ' === 向下计算 ===
            If downIndex >= 0 Then
                ' 计算泊松概率项
                term = .Poisson_Dist(downIndex, lambda, False)

                ' Beta分布项计算
                Dim beta1 As Double
                beta1 = .Beta_Dist(r, downIndex + 0.5, df / 2, True)

                ' 修正项计算(包含Gamma函数比值)
                Dim gammaRatio As Double
                gammaRatio = Exp(.GammaLn(downIndex + 1) - .GammaLn(downIndex + 1.5))
                Dim beta2 As Double
                beta2 = .Beta_Dist(r, downIndex + 1, df / 2, True)

                ' 累加计算结果
                sumP = sumP + term * (beta1 + (ncp / Sqr(2)) * gammaRatio * beta2)
                remainP = remainP - term
                downIndex = downIndex - 1
            End If

            ' === 向上计算 ===
            term = .Poisson_Dist(upIndex, lambda, False)
            beta1 = .Beta_Dist(r, upIndex + 0.5, df / 2, True)
            gammaRatio = Exp(.GammaLn(upIndex + 1) - .GammaLn(upIndex + 1.5))
            beta2 = .Beta_Dist(r, upIndex + 1, df / 2, True)

            sumP = sumP + term * (beta1 + (ncp / Sqr(2)) * gammaRatio * beta2)
            remainP = remainP - term
            upIndex = upIndex + 1

            iterCount = iterCount + 1
        Loop
    End With

    ' ============== 最终结果修正 ==============
    ' 添加标准正态分布的尾部修正项
    Dim normCorrection As Double
    normCorrection = Application.WorksheetFunction.Norm_S_Dist(-ncp, True)

    ' 综合计算结果
    NonCentralTCDF2 = sumP / 2 + normCorrection

    ' 确保结果在[0,1]范围内
    If NonCentralTCDF2 < 0 Then NonCentralTCDF2 = 0
    If NonCentralTCDF2 > 1 Then NonCentralTCDF2 = 1
End Function
其三、根据 Real Statistics Resource Pack for Excel 2010, 2013, 2016, 2019, 2021 or 365 for Windows 得到
Function NT_DIST(t As Double, df As Double, d As Double, cum As Boolean, _
    Optional iter As Long = 1000, Optional prec As Double = 0.000000000001) As Double

' return non-central t pdf if cum = FALSE or distribution if cum = TRUE at t with df degrees of freedom and
' non-centrality parameter d; iter is the number of iterations and prec is the precision of the answer

    If cum Then   ' distribution function
        If t >= 0 Then
            NT_DIST = NT_DIST_CDF(t, df, d, iter, prec)
        Else
            NT_DIST = 1 - NT_DIST_CDF(-t, df, -d, iter, prec)
        End If

    Else        ' pdf
        If Abs(t) < 0.00000001 Or (Abs(t) < 0.0000001 And d <= 0.35) Then ' t is close enough to zero
            NT_DIST = Exp(Application.WorksheetFunction.GammaLn((df + 1) / 2) - Application.WorksheetFunction.GammaLn(df / 2) - d ^ 2 / 2) / _
                Application.WorksheetFunction.SqrtPi(df)
        Else
            NT_DIST = df * (NT_DIST(t * Sqr(1 + 2 / df), df + 2, d, True, iter, prec) - NT_DIST(t, df, d, True, iter, prec)) / t
        End If
    End If

End Function

Private Function NT_DIST_CDF(t As Double, df As Double, d As Double, iter As Long, prec As Double) As Double
' return non-central t cdf at t >= 0 with df degrees of freedom and non-centrality parameter d
' iter is the number of iterations and prec is the precision of the answer

    Dim lambda As Double    ' mean of Poisson distribution
    lambda = d ^ 2 / 2
    Dim i As Long
    Dim df2 As Double       ' df/2
    df2 = df / 2
    Dim dsq As Double       ' d/sqrt(2)
    dsq = d / Sqr(2)
    Dim r As Double         ' r
    r = t ^ 2 / (t ^ 2 + df)
    Dim p As Double         ' p(i)
    Dim ptot As Double      ' total of the p(i)
    ptot = 1#
    Dim ctot As Double      ' total of the cdf values
    ctot = 0#
    Dim hi As Long          ' upper index
    Dim low As Long         ' lower index
    low = Int(lambda)
    hi = low + 1

    With Application.WorksheetFunction

        For i = 1 To iter
            If low >= 0 Then
                p = .Poisson_Dist(low, lambda, False)
                ptot = ptot - p
                ctot = ctot + p * .Beta_Dist(r, low + 0.5, df2, True) + _
                    dsq * p * Exp(.GammaLn(low + 1) - .GammaLn(low + 1.5)) * .Beta_Dist(r, low + 1#, df2, True)
                low = low - 1
            End If
            p = .Poisson_Dist(hi, lambda, False)
            ptot = ptot - p
            ctot = ctot + p * .Beta_Dist(r, hi + 0.5, df2, True) + _
                dsq * p * Exp(.GammaLn(hi + 1) - .GammaLn(hi + 1.5)) * .Beta_Dist(r, hi + 1#, df2, True)
            If ptot < prec Then Exit For
            hi = hi + 1
        Next

        NT_DIST_CDF = ctot / 2 + .Norm_S_Dist(-d, True)

    End With

End Function
功效计算 1-NT_DIST(T.INV(1-alpha/2,df),df, ncp,true)+NT_DIST(-T.INV(1-alpha/2,df),df, ncp,true)
| 单元格 | 内容 | 公式或值 |
|---|---|---|
| A1 | ncp(非中心参数) | -1.57142857142854 |
| A2 | df(自由度) | 8 |
| A3 | α(显著性水平) | 0.05 |
| A4 | t_crit(临界 t 值) | =T.INV(1 - A3 / 2, A2) |
| A5 | Power(功效值) | =1 - NonCentralTCDF(A4, A2, A1) + NonCentralTCDF(-A4, A2, A1) |
 |
Python脚本核验
import scipy.stats as stats

def power_calculation():
    # 参数设置
    delta = -0.12222222222222      # 均值差
    sigma = 0.233333333333333      # 标准差
    n = 9                          # 样本量
    df = n - 1                     # 自由度 = 8
    alpha = 0.05                   # 显著性水平
    ncp = delta / (sigma / (n**0.5))  # 非中心参数λ

    # 计算临界值(等效R的qt(0.975,8))
    t_crit = stats.t.ppf(1 - alpha/2, df)

    # 处理非中心参数符号问题(对称性转换)
    def pt_noncentral(q, df, nc):
        if nc < 0:
            return 1 - stats.nct.cdf(-q, df, -nc)
        else:
            return stats.nct.cdf(q, df, nc)

    # 计算右尾概率:P(T ≤ t_crit)
    right_tail = pt_noncentral(t_crit, df, ncp)

    # 计算左尾概率:P(T ≤ -t_crit)
    left_tail = pt_noncentral(-t_crit, df, ncp)

    # 总功效 = 1 - 右尾 + 左尾
    power = 1 - right_tail + left_tail
    return power

print(f"功效值: {power_calculation():.7f}")  # 输出:0.2834242
以上,Real1Statistics 的宏函数更接近 R 或者 Python 的计算结果。

 浙公网安备 33010602011771号