

CSharp: HighCharts in ASP.NET
科学方法与经验方法是相对的。科学方法通过发现一个单一的综合事实。来代替彼此分离的事实之间的重复联结或巧合。为了实现这个目的,必须把观察得来的粗糙的原始事实,分解成多个不能直接被感知的、更加微小的过程。
--杜威《我们如何思维》
Scientific Mechod
In contrast with the empirical method stands the scientific. Scientific ethod replaces the repeated conjunction or coincidence of separte facts by discovery of single cmprehensive fact, effecton this replacement by breaking up the coarse or gross facts of observation into a number of minuter processes not directly accessible to perception.
--Johnn Dewey <How We Think>
https://plato.stanford.edu/entries/scientific-method/
<%@ Page Language="C#" AutoEventWireup="true" CodeBehind="demo.aspx.cs" Inherits="highchartssample.demo" %>
<!DOCTYPE html>
<html xmlns="http://www.w3.org/1999/xhtml">
<head runat="server">
<title>HighCharts in ASP.NET / C#</title>
<!-- Import jQuery Library -->
<script type="text/javascript" src="Scripts/jquery-3.7.1.min.js"></script>
<!-- Import HighCharts Libraryhttps://code.highcharts.com -->
<script type="text/javascript" src="Scripts/highcharts/7.1.2/highcharts.js"></script>
<!-- Import HighCharts Export Library -->
<script type="text/javascript" src="Scripts/highcharts/7.1.2/modules/exporting.js"></script>
</head>
<body>
<form id="form1" runat="server">
<div>
<div id="barChartDiv" style="width: 600px; height: 500px;"></div>
<div id="pieChartDiv" style="width: 600px; height: 300px;"></div>
</div>
<script type="text/javascript">
// 确保在DOM和jQuery加载完成后执行
$(document).ready(function () {
$.ajax({
type: "POST",
url: "getdata.ashx", //WebMethod to be called demo.aspx/GetPopulation getdata.ashx
contentType: "application/json; charset=utf-8",
dataType: "json",
// 建议使用异步方式,避免阻塞浏览器
async: true,
success: function (data) {
// 打印原始数据确认结构
console.log("服务器返回数据:", data);
// 直接使用 data 作为根对象(因为没有 data.d)
var parsed = data;
// 验证是否为数组且包含数据
if (!Array.isArray(parsed) || parsed.length === 0) {
alert("无效的数据格式!预期是包含对象的数组: [{...}]");
return;
}
// 取数组中的第一个对象(你的数据结构是 [{...}])
var dataObj = parsed[0];
var population = [];
// 遍历对象的键值对,转换为图表所需格式
for (var key in dataObj) {
if (dataObj.hasOwnProperty(key)) {
var value = parseFloat(dataObj[key]);
if (!isNaN(value)) {
population.push([key, value]); // 格式: [省份名称, 数值]
} else {
console.warn("跳过无效数值: 键=" + key + ", 值=" + dataObj[key]);
}
}
}
// 验证是否有有效数据
if (population.length === 0) {
alert("没有可用于绘制图表的有效数据!");
return;
}
//Calling chart functions with population data
DrawBarChart(population);
DrawPieChart(population);
},
error: function (response) {
var r = jQuery.parseJSON(response.responseText);
alert("Message: " + r.Message);
alert("StackTrace: " + r.StackTrace);
alert("ExceptionType: " + r.ExceptionType);
}
});
});
//Function to draw Pie Chart
function DrawPieChart(population) {
var chart = new Highcharts.Chart({
chart: {
renderTo: 'pieChartDiv', //Target Div for chart
defaultSeriesType: 'pie'
},
title: {
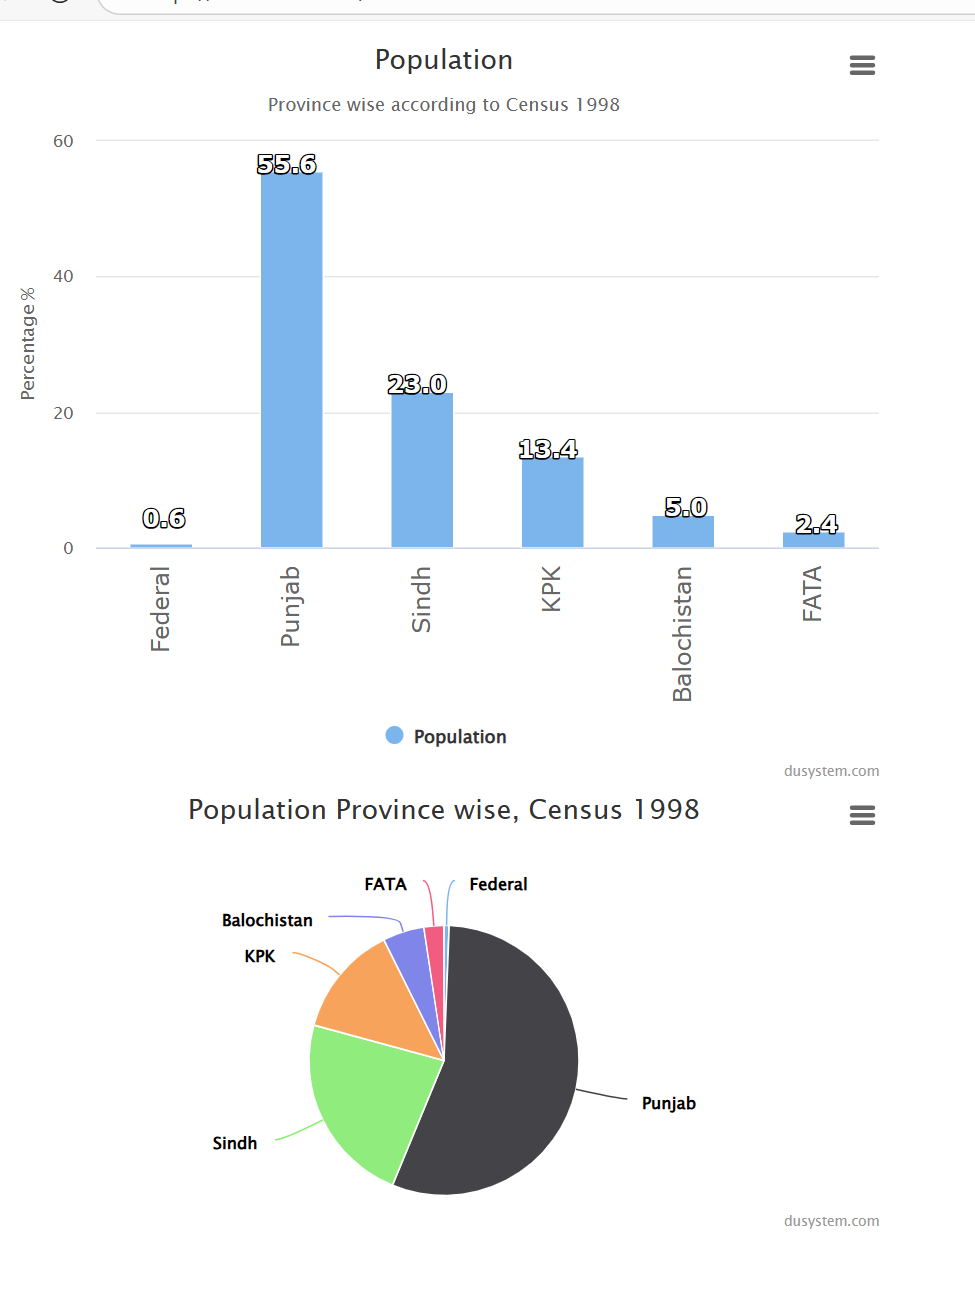
text: 'Population Province wise, Census 1998'
},
series: [{
data: population //Binding json data to chart
}]
});
}
//Function to draw Bar Chart
function DrawBarChart(population) {
$('#barChartDiv').highcharts({
chart: { type: 'column' }, //Bar Chart
title: { text: 'Population' },
subtitle: { text: 'Province wise according to Census 1998' },
xAxis: { type: 'category', labels: { rotation: -90, style: { fontSize: '16px', fontFamily: 'Verdana, sans-serif' } } },
yAxis: { min: 0, title: { text: 'Percentage %' } },
legend: { enabled: true },
tooltip: { pointFormat: 'Percentage: <b>{point.y:.2f}</b> %' },
series: [{
name: 'Population',
data: population, //Binding data
dataLabels: {
enabled: true, rotation: -0, color: '#FFFFFF', align: 'right', format: '{point.y:.1f}', y: 10,
style: { fontSize: '16px', fontFamily: 'Verdana, sans-serif' }
}
}]
});
}
</script>
</form>
</body>
</html>
<%@ Page Language="C#" AutoEventWireup="true" CodeBehind="WebForm1.aspx.cs" Inherits="NovelCoronaWorld.WebForm1" %>
<!DOCTYPE html>
<html xmlns="http://www.w3.org/1999/xhtml">
<head id="Head1" runat="server">
    <title>HighCharts in ASP.NET / C#</title>
    <!-- Import jQuery Library -->
   <script type="text/javascript" src="js/jquery-3.7.1.js"></script>
    <!-- Import HighCharts Libraryhttps://code.highcharts.com -->
    <script type="text/javascript" src="Highcharts/8.1.0/highcharts.js"></script>
    <!-- Import HighCharts Export Library -->
    <script type="text/javascript" src="Highcharts/8.1.0/modules/exporting.js"></script>
</head>
<body>
     <form id="form1" runat="server">
    <div>
        <div id="barChartDiv" style="width: 600px; height: 500px;"></div>

        <div id="pieChartDiv" style="width: 600px; height: 300px;"></div>
    </div>
    <script type="text/javascript">
        // 确保在DOM和jQuery加载完成后执行
        $(document).ready(function () {
            $.ajax({
                type: "POST",
                url: "WebForm1.aspx/GetPopulation", //WebMethod to be called demo.aspx/GetPopulation   getdata.ashx
                contentType: "application/json; charset=utf-8",
                dataType: "json",
                // 建议使用异步方式,避免阻塞浏览器
                async: true,
                success: function (data) {
                    // 打印原始数据确认结构
                    console.log("服务器返回数据:", data);
                    // 打印原始数据(F12控制台查看)
                    console.log("服务器返回的原始数据:", data);
                    console.log("数据类型:", typeof data);
                    console.log("是否为数组:", Array.isArray(data));
                    // 第一步:获取 data.d(WebMethod 标准包装)
                    if (typeof data.d === "undefined") {
                        alert("错误:未找到 data.d 属性");
                        return;
                    }

                    // 第二步:解析 data.d 中的 JSON 字符串(因为它是字符串格式的数组)
                    var parsedArray;
                    try {
                        parsedArray = JSON.parse(data.d); // 将字符串解析为数组
                    } catch (e) {
                        alert("解析 data.d 失败:" + e.message + "\n原始内容:" + data.d);
                        return;
                    }

                    // 第三步:验证解析后是否为数组且包含数据
                    if (!Array.isArray(parsedArray) || parsedArray.length === 0) {
                        alert("无效的数据格式!\n预期: 包含对象的数组 [{...}]\n实际解析结果: " + JSON.stringify(parsedArray));
                        return;
                    }

                    // 后续处理(和之前相同)
                    var dataObj = parsedArray[0]; // 取数组中的第一个对象
                    var population = [];

                    for (var key in dataObj) {
                        if (dataObj.hasOwnProperty(key)) {
                            var value = parseFloat(dataObj[key]);
                            if (!isNaN(value)) {
                                population.push([key, value]);
                            } else {
                                console.warn("跳过无效数值: 键=" + key + ", 值=" + dataObj[key]);
                            }
                        }
                    }

                    if (population.length > 0) {
                        DrawBarChart(population);
                        DrawPieChart(population);
                    } else {
                        alert("没有有效数据可绘制图表");
                    }


                },
                error: function (response) {
                    var r = jQuery.parseJSON(response.responseText);
                    alert("Message: " + r.Message);
                    alert("StackTrace: " + r.StackTrace);
                    alert("ExceptionType: " + r.ExceptionType);
                }
            });
        });

        //Function to draw Pie Chart
        function DrawPieChart(population) {
            var chart = new Highcharts.Chart({
                chart: {
                    renderTo: 'pieChartDiv',   //Target Div for chart
                    defaultSeriesType: 'pie'
                },
                title: {
                    text: 'Population Province wise, Census 1998'
                },
                series: [{
                    data: population   //Binding json data to chart
                }]
            });
        }

        //Function to draw Bar Chart
        function DrawBarChart(population) {
            $('#barChartDiv').highcharts({
                chart: { type: 'column' },  //Bar Chart
                title: { text: 'Population' },
                subtitle: { text: 'Province wise according to Census 1998' },
                xAxis: { type: 'category', labels: { rotation: -90, style: { fontSize: '16px', fontFamily: 'Verdana, sans-serif'}} },
                yAxis: { min: 0, title: { text: 'Percentage %'} },
                legend: { enabled: true },
                tooltip: { pointFormat: 'Percentage: <b>{point.y:.2f}</b> %' },
                series: [{
                    name: 'Population',
                    data: population,  //Binding data
                    dataLabels: {
                        enabled: true, rotation: -0, color: '#FFFFFF', align: 'right', format: '{point.y:.1f}', y: 10,
                        style: { fontSize: '16px', fontFamily: 'Verdana, sans-serif' }
                    }
                }]
            });
        }
    </script>

    </form>
</body>
</html>
using System;
using System.Collections.Generic;
using System.Linq;
using System.Web;
using System.Web.UI;
using System.Web.UI.WebControls;
using System.Data;
using Newtonsoft.Json;
using System.Web.Script.Services;
using System.Web.Services;

namespace NovelCoronaWorld
{

    public class DBClass
    {
        private DataTable table;

        public DBClass()
        {
            table = new DataTable();
        }

        public DataTable GetDataTable()
        {
            table.Columns.Add("Federal");
            table.Columns.Add("Punjab");
            table.Columns.Add("Sindh");
            table.Columns.Add("KPK");
            table.Columns.Add("Balochistan");
            table.Columns.Add("FATA");
            table.Rows.Add(0.61, 55.62, 22.99, 13.41, 4.96, 2.40);

            return table;
        }
    }


    /// <summary>
    ///
    /// </summary>
    public partial class WebForm1 : System.Web.UI.Page
    {


        /// <summary>
        ///
        /// </summary>
        /// <param name="sender"></param>
        /// <param name="e"></param>
        protected void Page_Load(object sender, EventArgs e)
        {

        }


        /// <summary>
        /// url 重写不可以用。需要配置在 web.config 中
        /// </summary>
        /// <returns></returns>
        [WebMethod]
        [ScriptMethod(UseHttpGet = false, ResponseFormat = ResponseFormat.Json)] // 确保使用POST
        public static string GetPopulation()
        {
            DBClass objDB = new DBClass(); //Database Class for dynamic data
            DataTable recTable = new DataTable();
            recTable = objDB.GetDataTable(); //Get Table from database

            //Convert Data Table to JSON with Newtonsoft's Json.NET
            string JSONdata = JsonConvert.SerializeObject(recTable);

            return JSONdata;
        }
    }
}
哲学管理(学)人生, 文学艺术生活, 自动(计算机学)物理(学)工作, 生物(学)化学逆境, 历史(学)测绘(学)时间, 经济(学)数学金钱(理财), 心理(学)医学情绪, 诗词美容情感, 美学建筑(学)家园, 解构建构(分析)整合学习, 智商情商(IQ、EQ)运筹(学)生存.---Geovin Du(涂聚文)

 浙公网安备 33010602011771号