

highcharts.Js
<!DOCTYPE>
<html>
<head runat="server">
<meta charset="UTF-8" />
<title>geovindu</title>
<meta name="keywords" content="Geovin Du"/>
<meta name="description" content="Geovin Du" />
<meta name="author" content="Geovin Du" />
<meta name="copyright" content="涂聚文 Geovin Du" />
<meta name="robots" content="follow, all" />
<script type="text/javascript" src="http://code.jquery.com/jquery-1.9.1.js"></script>
<script src="http://code.highcharts.com/highcharts.js" type="text/javascript"></script>
<script type="text/javascript" src="js/highcharts-zh_CN.js"></script>
<!-- 2. Include the Highcharts exporting module script. -->
<script src="http://code.highcharts.com/modules/exporting.js" type="text/javascript"></script>
<script type="text/javascript">
var chart = null;
var strtile='<%=strtitle %>'
$(function () {
chart = Highcharts.chart('container', {
chart: {
zoomType: 'x'
},
title: {
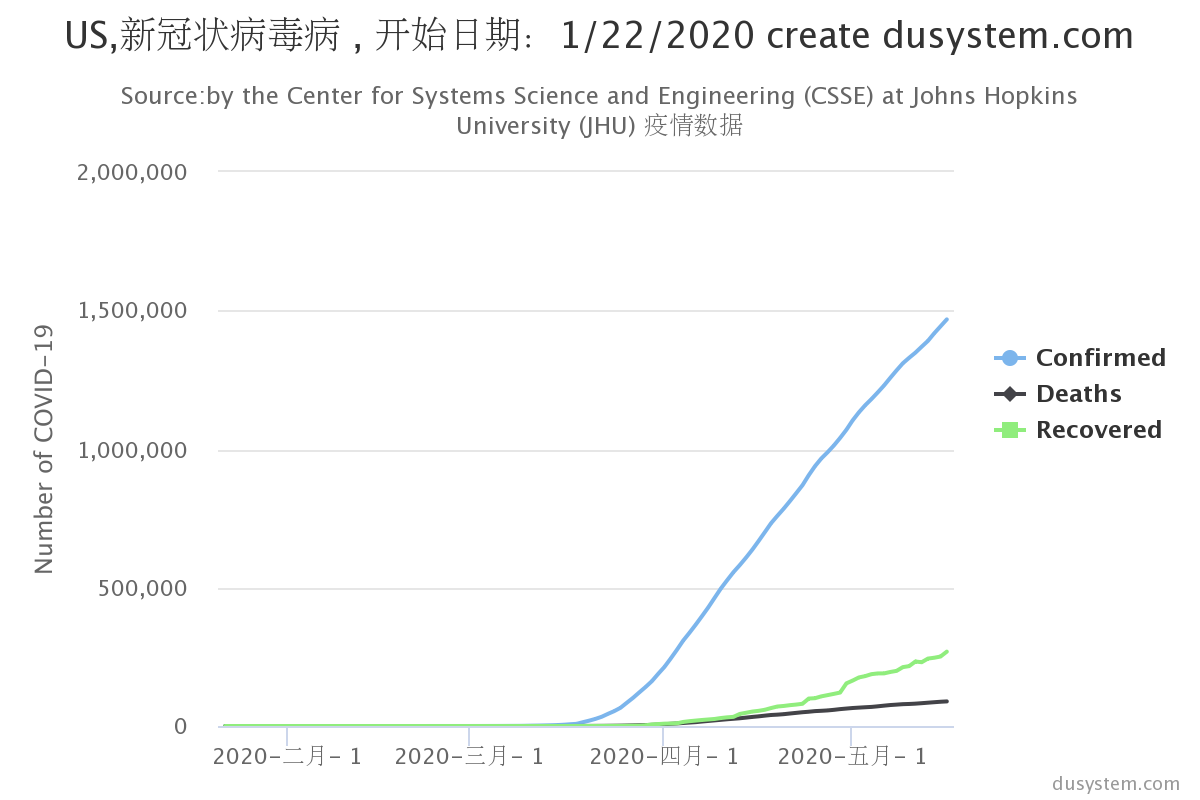
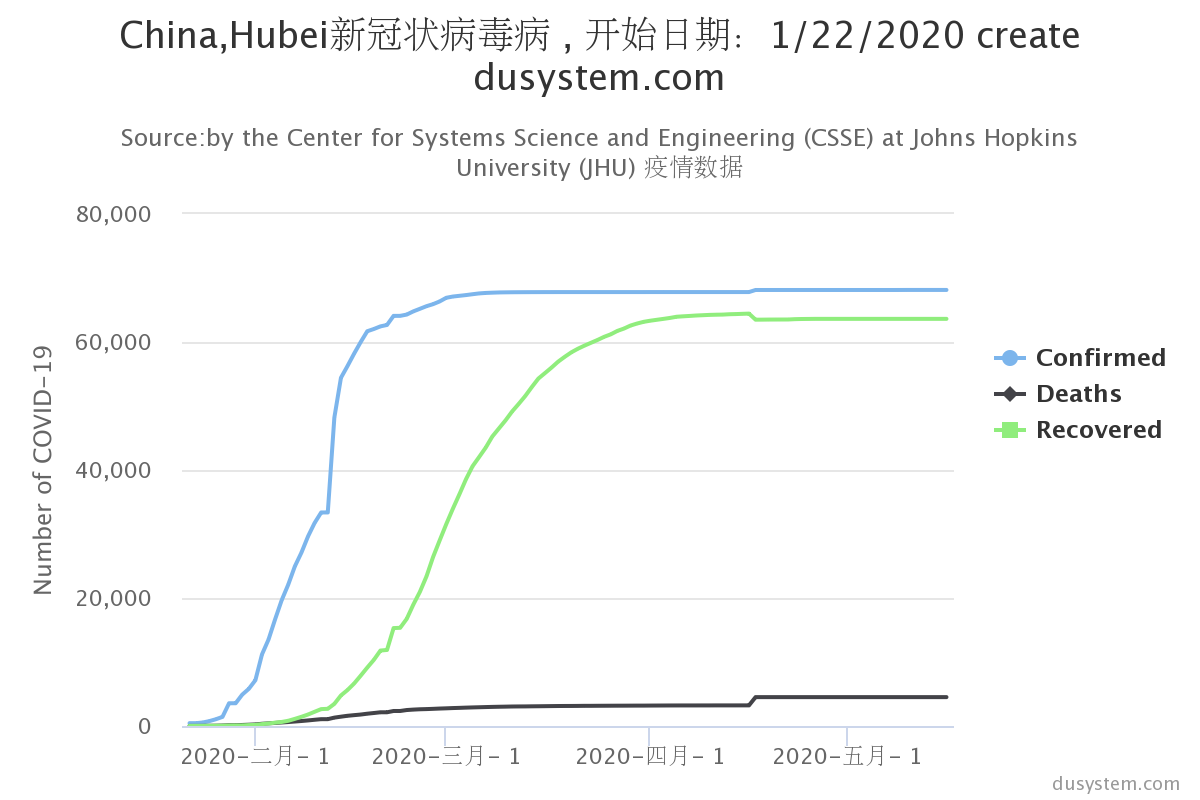
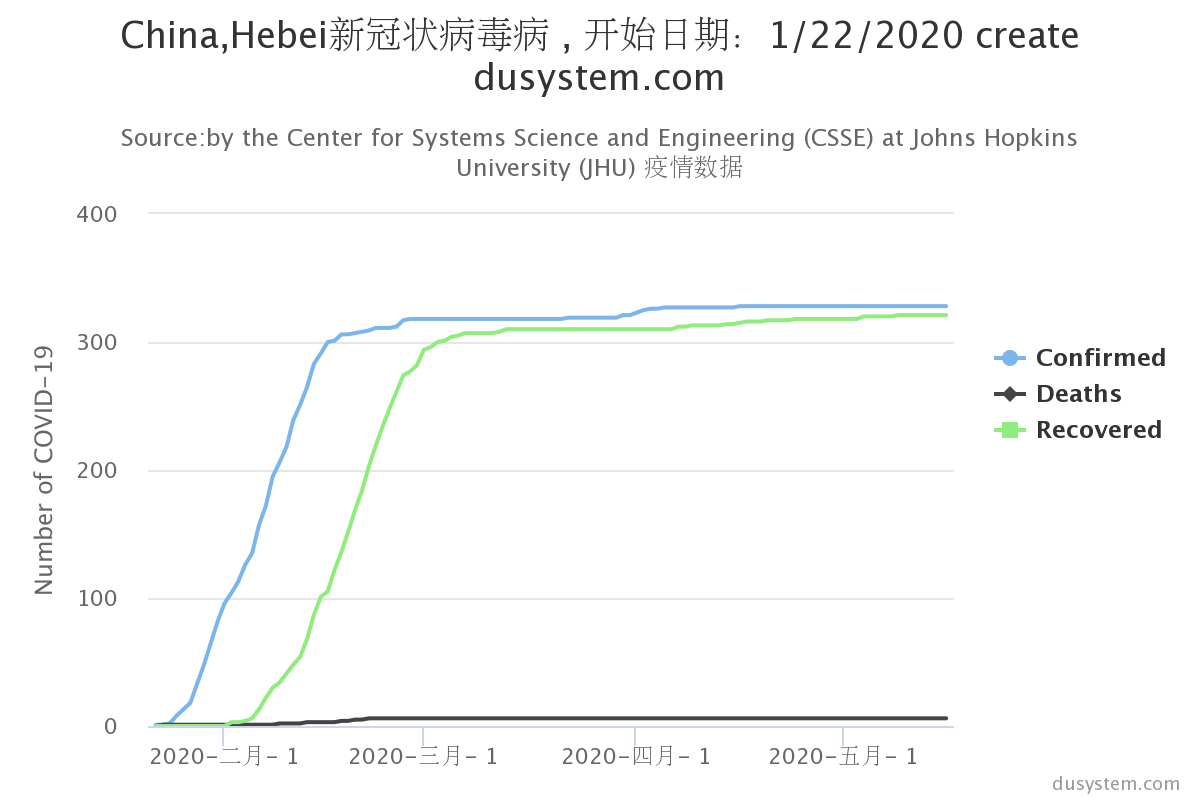
text: strtile+'新冠状病毒病 , 开始日期:1/22/2020 create dusystem.com'
},
subtitle: {
text: 'Source:by the Center for Systems Science and Engineering (CSSE) at Johns Hopkins University (JHU) 疫情数据 '
},
yAxis: {
title: {
text: 'Number of COVID-19'
}
},
xAxis: {
type: 'datetime',
minRange: 1 * 24 * 3600000, // 1天
dateTimeLabelFormats: {
day: '%Y-%m-%d',
week: '%m-%d',
month: '%Y-%m',
year: '%Y'
},
labels: {
format: '{value:%Y-%b-%e}'
},
accessibility: {
rangeDescription: 'Range: 2020 to 2020'
}
},
legend: {
layout: 'vertical',
align: 'right',
verticalAlign: 'middle'
},
plotOptions: {
series: {
label: {
connectorAllowed: false
},
pointInterval: 24 * 3600 * 1000, //1天
pointStart: Date.UTC(2020, 0, 22) //2020/1/22
}
},
series: [
{
name: 'Confirmed', //确诊人数
data: <%=jsonConfirmed %>
}, {
name: 'Deaths', //死亡人数
data: <%=jsonDeaths %>
}, {
name: 'Recovered', //治愈人数
data: <%=jsonRecovered %>
}
],
responsive: {
rules: [{
condition: {
maxWidth: 500
},
chartOptions: {
legend: {
layout: 'horizontal',
align: 'center',
verticalAlign: 'bottom'
}
}
}]
}
});
});
</script>
</head>
<body>
<form id="form1" runat="server">
<div>
<asp:GridView ID="GridView1" runat="server">
</asp:GridView>
<div id="container" style="max-width:800px;height:400px"></div>
</div>
</form>
</body>
</html>
数据来源:https://corona-virus-covid19.com/
https://covid2019-api.herokuapp.com/docs
<!DOCTYPE HTML>
<html>
<head runat="server">
<meta http-equiv="Content-Type" content="text/html; charset=utf-8">
		<meta name="viewport" content="width=device-width, initial-scale=1">
		<title>Highcharts Example</title>
   <meta name="keywords" content="Geovin Du"/>
    <meta name="description"  content="Geovin Du" />
    <meta name="author" content="Geovin Du" />
    <meta name="copyright" content="涂聚文 Geovin Du" />
    <meta name="robots" content="follow, all" />
<script type="text/javascript" src="Highcharts/code/highcharts.js"></script>
<script type="text/javascript" src="Highcharts/code/modules/series-label.js"></script>
<script type="text/javascript" src="Highcharts/code/modules/exporting.js"></script>
<script type="text/javascript" src="Highcharts/code/modules/export-data.js"></script>
<script type="text/javascript" src="Highcharts/code/modules/accessibility.js"></script>
<script type="text/javascript" src="Highcharts/code/highcharts-zh_CN.js"></script>
		<style type="text/css">
.highcharts-figure, .highcharts-data-table table {
    min-width: 360px;
    max-width: 800px;
    margin: 1em auto;
}

.highcharts-data-table table {
	font-family: Verdana, sans-serif;
	border-collapse: collapse;
	border: 1px solid #EBEBEB;
	margin: 10px auto;
	text-align: center;
	width: 100%;
	max-width: 500px;
}
.highcharts-data-table caption {
    padding: 1em 0;
    font-size: 1.2em;
    color: #555;
}
.highcharts-data-table th {
	font-weight: 600;
    padding: 0.5em;
}
.highcharts-data-table td, .highcharts-data-table th, .highcharts-data-table caption {
    padding: 0.5em;
}
.highcharts-data-table thead tr, .highcharts-data-table tr:nth-child(even) {
    background: #f8f8f8;
}
.highcharts-data-table tr:hover {
    background: #f1f7ff;
}

		</style>
</head>
<body>
    <form id="form1" runat="server">
    <div>
    <figure class="highcharts-figure">
    <div id="container"></div>
    <p class="highcharts-description">
        Basic line chart showing trends in a dataset. This chart includes the
        <code>series-label</code> module, which adds a label to each line for
        enhanced readability.
    </p>
</figure>
    </div>
    </form>
    <script type="text/javascript">
        Highcharts.chart('container', {

            title: {
                text: 'Solar Employment Growth by Sector, 2010-2016'
            },

            subtitle: {
                text: '中国: dusystem.com 涂聚文'
            },

            yAxis: {
                title: {
                    text: 'Number of Employees'
                }
            },

            xAxis: {
                accessibility: {
                    rangeDescription: 'Range: 2010 to 2017'
                }
            },

            legend: {
                layout: 'vertical',
                align: 'right',
                verticalAlign: 'middle'
            },

            plotOptions: {
                series: {
                    label: {
                        connectorAllowed: false
                    },
                    pointStart: 2010
                }
            },

            series: [{
                name: 'Installation',
                data: [43934, 52503, 57177, 69658, 97031, 119931, 137133, 154175]
            }, {
                name: 'Manufacturing',
                data: [24916, 24064, 29742, 29851, 32490, 30282, 38121, 40434]
            }, {
                name: 'Sales & Distribution',
                data: [11744, 17722, 16005, 19771, 20185, 24377, 32147, 39387]
            }, {
                name: 'Project Development',
                data: [null, null, 7988, 12169, 15112, 22452, 34400, 34227]
            }, {
                name: 'Other',
                data: [12908, 5948, 8105, 11248, 8989, 11816, 18274, 18111]
            }],

            responsive: {
                rules: [{
                    condition: {
                        maxWidth: 500
                    },
                    chartOptions: {
                        legend: {
                            layout: 'horizontal',
                            align: 'center',
                            verticalAlign: 'bottom'
                        }
                    }
                }]
            }

        });
		</script>
</body>
</html>
哲学管理(学)人生, 文学艺术生活, 自动(计算机学)物理(学)工作, 生物(学)化学逆境, 历史(学)测绘(学)时间, 经济(学)数学金钱(理财), 心理(学)医学情绪, 诗词美容情感, 美学建筑(学)家园, 解构建构(分析)整合学习, 智商情商(IQ、EQ)运筹(学)生存.---Geovin Du(涂聚文)


 浙公网安备 33010602011771号