

pandas中DataFrame操作(二)
1、利用groupby和聚合函数生成矩阵
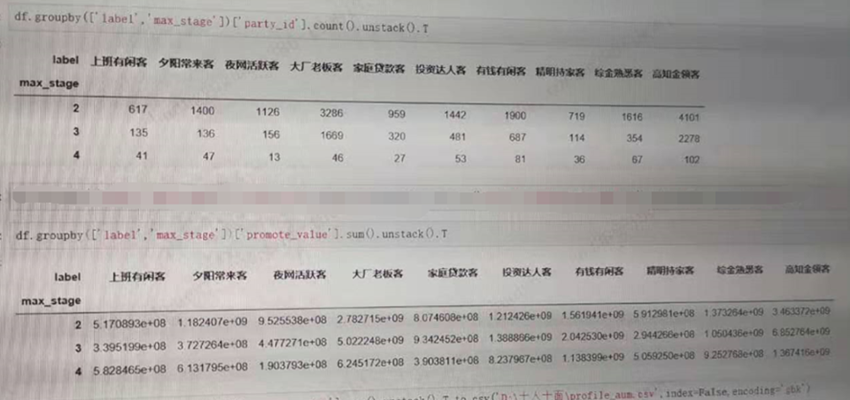
#unstack表示不折叠,展开。只有这样才会是矩阵形式,T就是表示转置一下,不需要转置,可以不加T
df.groupby(['label','max_stage'])['party_id'].count().unstack().T
df.groupby(['label','max_stage'])['promote_value'].sum().unstack().T
2、读取时抽样 1%
对于动辄就几十或几百个 G 的数据,在读取这么大数据时,有没有办法随机选取一小部分数据,然后读入内存,快速了解数据和开展 EDA ?
使用 Pandas 的 skiprows 和 概率知识,就能做到。
下面解释具体怎么做。
如下所示,读取某 100 G 大小的 big_data.csv 数据
-
使用 skiprows 参数,
-
x > 0 确保首行读入,
-
np.random.rand() > 0.01 表示 99% 的数据都会被随机过滤掉
言外之意,只有全部数据的 1% 才有机会选入内存中。
import pandas as pd
import numpy as np

df = pd.read_csv("big_data.csv",
skiprows = lambda x: x>0 and
np.random.rand() > 0.01)

print("The shape of the df is {}.
It has been reduced 100 times!".format(df.shape))
使用这种方法,读取的数据量迅速缩减到原来的 1% ,对于迅速展开数据分析有一定的帮助
3、replace 做清洗
customer    sales
0    A    1100
1    B    950.5RMB
2    C    $400
3    D    $1250.75
看到 sales 列的值,有整型,浮点型+RMB后变为字符串型,还有美元+整型,美元+浮点型。
我们的目标:清洗掉 RMB,$ 符号,转化这一列为浮点型。
一行代码搞定:
df["sales"] = df["sales"].replace("[$,RMB]", "", regex = True).astype("float")
使用正则替换,将要替换的字符放到列表中 [$,RMB],替换为空字符,即 "";
最后使用 astype 转为 float
打印结果:
customer    sales
0    A    1100.00
1    B    950.50
2    C    400.00
3    D    1250.75
4、宽DF变长
district_code    apple    banana    orange
0    12345    5.2    3.5    8.0
1    56789    2.4    1.9    7.5
2    101112    4.2    4.0    6.4
3    131415    3.6    2.3    3.9
5.2 表示 12345 区域的 apple 价格,并且 apple, banana, orange,这三列都是一种水果,那么如何把这三列合并为一列?
使用 pd.melt
具体参数取值,大家根据此例去推敲:
df = df.melt(\
id_vars = "district_code",
var_name = "fruit_name",
value_name = "price")
df
district_code    fruit_name    price
0    12345    apple    5.2
1    56789    apple    2.4
2    101112    apple    4.2
3    131415    apple    3.6
4    12345    banana    3.5
5    56789    banana    1.9
6    101112    banana    4.0
7    131415    banana    2.3
8    12345    orange    8.0
9    56789    orange    7.5
10    101112    orange    6.4
11    131415    orange    3.9
5.DataFrame 转 HTML
如果你需要用 HTML 发送自动报告,那么 to_html 函数了解一下。
比如,我们先设定这样一个 DataFrame:
import numpy as np
import pandas as pd
import random

n = 10
df = pd.DataFrame(
    {
        "col1": np.random.random_sample(n),
        "col2": np.random.random_sample(n),
        "col3": [[random.randint(0, 10) for _ in range(random.randint(3, 5))] for _ in range(n)],
    }
)
用上 to_html,就可以将表格转入 html 文件:
df_html = df.to_html()
with open(‘analysis.html’, ‘w’) as f: f.write(df_html)

与之配套的,是 read_html 函数,可以将 HTML 转回 DataFrame。
6、DataFrame 转 Markdown
如果你想把代码放到 GitHub 上,需要写个 README。
这时候,你可能需要把 DataFrame 转成 Markdown 格式。
Pandas 同样为你考虑到了这一点:
print(df.to_markdown())
7.、data_range
从外部 API 或数据库获取数据时,需要多次指定时间范围。
Pandas 的 data_range 覆盖了这一需求。
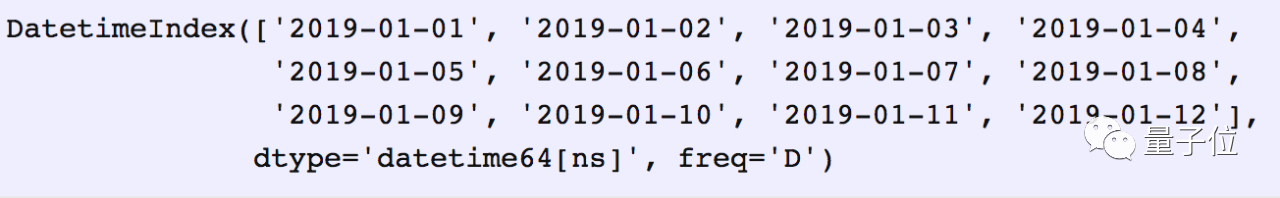
import pandas as pd
date_from = “2019-01-01”
date_to = “2019-01-12”
date_range = pd.date_range(date_from, date_to, freq=”D”)
print(date_range)
freq = “D”/“M”/“Y”,该函数就会分别返回按天、月、年递增的日期。
8、节省磁盘空间
Pandas在保存数据集时,可以对其进行压缩,其后以压缩格式进行读取。
先搞一个 300MB 的 DataFrame,把它存成 csv。
f = pd.DataFrame(pd.np.random.randn(50000,300))
df.to_csv(‘random_data.csv’, index=False)
压缩一下试试
df.to_csv(‘random_data.gz’, compression=’gzip’, index=False)
文件就变成了136MB。
gzip压缩文件可以直接读取:
df = pd.read_csv(‘random_data.gz’)

 浙公网安备 33010602011771号