

Prometheus(七) 监控spring boot docker 容器
主要步骤
- 通过Prometheus提供的Java client包,在spring boot工程中生成我们关心的业务指标,
- 将spring boot工程打成docker 镜像
- 将docker容器部署到docker swarm集群中
- 修改Prometheus对应的
file_sd_configs文件,将部署的服务追加进去 - 通过Grafana观察业务指标
本文主要阐述的是对容器中业务指标的监控,对容器的监控以及环境的搭建参照[Prometheus 监控Docker Swarm](Prometheus 监控Docker Swarm.md)
Prometheus感念
-
数据模型
Prometheus中的数据都是时间序列值。以相同指标名称,并且拥有相同label来作为一个观察量,Prometheus中存的就是各种观察量在不同时间点的数据,称为一个时间序列,每个时间点对应的值称为一个Sample,包含一个float64数值和一个精确到毫秒的时间值。
每个序列通过指标名称以及相关的label来唯一确定,指标名称主要来表明需要观测的系统特性如(
http_requests_total表示系统受到请求总数的时间序列),同一指标中的每个key/value对(称为label)都称作一个维度,如(http_requests_total{code=200})代表请求成功的时间序列.外部应用通过PromQL来对时间序列进行相应的查找,在查询时还可以利用Prometheus提供的功能丰富的函数对时间序列中的值进行计算。
-
指标类型
Prometheus提供的客户端jar包中把指标类型分为如下四种
- Counter
- Gauge
- Histogram
- Summary
这个分类只针对客户端使用者有效,在Prometheus server端是不进行区分的。对于Prometheus server端而言,客户端返回的都是时间序列对应的一个Sample,如
http_requests_total{code=200} 290,表示Prometheus server拉取指标的这个时间点,请求成功的总数是290次,是一个纯文本数据,即便我们不用Prometheus提供的客户端,只要返回的数据满足这种格式,Prometheus server就能正常存储,也可以通过PromQL供外部查询。-
Counter
Counter对应的指标值只能是一个单独的数值,并且除了能在服务启动时重置外,只能对指标值做累加操作,不能做减法操作,可以用来统计请求次数、任务执行次数、关键业务对象操作次数等。
-
Gauge
Gauge对应的指标值只能是一个单独的数值,与Counter不同的是,可以对Gauge代表的指标值做仁义的加减操作,一般用来表示温度、正在执行的job等指标
-
Histogram
Histogram 柱状图,不再是简单对指标的sample值进行加减等操作,对于每一个sample值执行下面的三个操作:
- 根据Histogram定义时指定的bucket区间,将sample分到各个bucket中,每个bucket中存放的是落入这个区间的个数
- 对每个采样点值累计和(sum)
- 对采样点的次数累计和(count)
例如我们通过Prometheus提供的客户端通过
Histogram.build().name("job_execute_time").help("job执行时间时间分布(分)").buckets(1,5,10) .register();定义了一个histogram,用来统计job执行时间的分布。对应的buckets是(1,5,10),代表四个区间- <=1分钟
- <=5分钟
- <=10分钟
- <无穷大
Histogram会生成如下6个维度的指标值
job_execute_time_bucket{le="1.0",}
job_execute_time_bucket{le="5.0",}
job_execute_time_bucket{le="10.0",}
job_execute_time_bucket{le="+Inf",}
job_execute_time_count
job_execute_time_sum
当我们有一个job执行时间为5.6分钟,则对应的各个维度的值变成
job_execute_time_bucket{le="1.0",} 0.0
job_execute_time_bucket{le="5.0",} 0.0
job_execute_time_bucket{le="10.0",} 1.0
job_execute_time_bucket{le="+Inf",} 1.0
job_execute_time_count 1.0
job_execute_time_sum  5.6
无穷大的肯定是和
job_execute_time_count一致的可以看到Histogram类型的指标不会保留各个sample的具体数值,每个bucket中也只是记录样本数的counter。
-
Summary 采样点分位图统计,类似于histgram,但是采用分位数来将sample分到不同的bucket中,具体的区别查看HISTOGRAMS AND SUMMARIES,个人数学不好,理解的太痛苦了。
构建spring boot工程(2.x)
-
pom.xml中追加Prometheus相关依赖
<dependency> <groupId>org.springframework.boot</groupId> <artifactId>spring-boot-starter-actuator</artifactId> </dependency> <dependency> <groupId>io.micrometer</groupId> <artifactId>micrometer-core</artifactId> </dependency> <dependency> <groupId>io.micrometer</groupId> <artifactId>micrometer-registry-prometheus</artifactId> </dependency> <dependency> <groupId>io.prometheus</groupId> <artifactId>simpleclient</artifactId> <version>0.8.1</version> </dependency> -
application.yml 文件中追加启用Prometheus相关metric,
spring: application: name: sbprometheus server: port: 8080 management: metrics: export: prometheus: enabled: true endpoint: metrics: enabled: true prometheus: enabled: true endpoints: web: exposure: include: ["prometheus","health"]- 默认情况 prometheus对应的endpoint是 /actuator/prometheus
-
定义业务需要的指标
/** * */ package chengf.falcon.sb.prometheus; import org.springframework.beans.factory.annotation.Autowired; import org.springframework.beans.factory.annotation.Value; import org.springframework.context.annotation.Bean; import org.springframework.context.annotation.Configuration; import io.micrometer.prometheus.PrometheusMeterRegistry; import io.prometheus.client.Counter; import io.prometheus.client.Gauge; import io.prometheus.client.Histogram; import io.prometheus.client.Summary; /** * @author: 作者: chengaofeng * @date: 创建时间:2020-03-20 12:04:20 * @Description: TODO * @version V1.0 */ @Configuration public class MetricConfig { @Autowired PrometheusMeterRegistry registry; @Value("${spring.application.name}") String appName; @Bean public Counter operatorCount() { return Counter.build().name(appName + "_class_operator_count").help("操作总次数").labelNames("className") .register(registry.getPrometheusRegistry()); } @Bean public Gauge runningJob() { return Gauge.build().name(appName + "_running_job_count").help("正在运行的job数") .register(registry.getPrometheusRegistry()); } @Bean public Histogram executeTime() { return Histogram.build().name(appName + "_job_execute_time").help("job执行时间时间分布(分)").buckets(1,5,10) .register(registry.getPrometheusRegistry()); } @Bean public Summary timeQuantile() { return Summary.build().name(appName + "_job_execute_time_quantile").help("job执行时间时间分布(分)").quantile(0.5, 0.05).quantile(0.9, 0.01) .register(registry.getPrometheusRegistry()); } } -
业务代码中更新指标(通过resturl模拟实际的操作)
/** * */ package chengf.falcon.sb.prometheus; import org.springframework.beans.factory.annotation.Autowired; import org.springframework.web.bind.annotation.PathVariable; import org.springframework.web.bind.annotation.RequestMapping; import org.springframework.web.bind.annotation.RestController; import io.prometheus.client.Counter; import io.prometheus.client.Gauge; import io.prometheus.client.Histogram; import io.prometheus.client.Summary; /** * @author: 作者: chengaofeng * @date: 创建时间:2020-03-03 19:02:43 * @Description: TODO * @version V1.0 */ @RestController public class MetricController { @Autowired Counter operatorCount; @Autowired Gauge runningJob; @Autowired Histogram executeTime; @Autowired Summary timeQuantile; @RequestMapping("/counter/{className}") public String counter(@PathVariable String className) { operatorCount.labels(className).inc(); return "COUNTER"; } @RequestMapping("/guage/{number}") public String guage(@PathVariable int number) { runningJob.set(number); return "guage"; } @RequestMapping("/histogram/{time}") public String histogram(@PathVariable double time) { executeTime.observe(time); return "histogram"; } @RequestMapping("/summary/{time}") public String summary(@PathVariable double time) { timeQuantile.observe(time); return "summary"; } } -
启动sprong-boot工程,访问上面的restful接口几次,然后访问
/actuator/prometheus查看指标情况,下面贴出一个样例(去除掉spring 自动给我们生成的各种指标)# HELP sbprometheus_job_execute_time_quantile job执行时间时间分布(分) # TYPE sbprometheus_job_execute_time_quantile summary sbprometheus_job_execute_time_quantile{quantile="0.5",} 5.0 sbprometheus_job_execute_time_quantile{quantile="0.9",} 13.0 sbprometheus_job_execute_time_quantile_count 11.0 sbprometheus_job_execute_time_quantile_sum 120.0 # HELP sbprometheus_job_execute_time job执行时间时间分布(分) # TYPE sbprometheus_job_execute_time histogram sbprometheus_job_execute_time_bucket{le="1.0",} 2.0 sbprometheus_job_execute_time_bucket{le="5.0",} 3.0 sbprometheus_job_execute_time_bucket{le="10.0",} 3.0 sbprometheus_job_execute_time_bucket{le="+Inf",} 3.0 sbprometheus_job_execute_time_count 3.0 sbprometheus_job_execute_time_sum 6.5 # HELP sbprometheus_class_operator_count 操作总次数 # TYPE sbprometheus_class_operator_count counter sbprometheus_class_operator_count{className="transform",} 2.0 sbprometheus_class_operator_count{className="sub",} 1.0 # HELP sbprometheus_running_job_count 正在运行的job数 # TYPE sbprometheus_running_job_count gauge sbprometheus_running_job_count 10.0
生成docker镜像
因为在spring-boot工程的pom中,我们追加了spring-boot-maven-plugin这个插件,所以执行mvn package后会生成一个独立的可执行jar,所以制作镜像时,只用基于openjdk的镜像,再把这个jar copy进去,之后启动就可以了.
-
构建(在工程目录下)
$ mvn clean package $ cd target $ cat > Dockerfile<<EOF #基础镜像基于openjdk,利用alpine FROM openjdk:8u212-jdk-alpine #所属团队 MAINTAINER chengf #将编译好的工程jar包copy到镜像容器中 ENV TARGET_JAR="sb-prometheus-0.0.1-SNAPSHOT.jar" COPY ${TARGET_JAR} /usr/src/${TARGET_JAR} # 工作目录 WORKDIR /usr/src #程序入口 RUN echo "java -jar \${TARGET_JAR} > start.sh \ && chmod 777 start.sh CMD ./start.sh EOF $ docker build -t sb-prometheus:0.0.1 . -
启动镜像,测试镜像是否正确
docker run --rm --name sb-prometheus -p 8080:8080 sb-prometheus:0.0.1- 访问一些我们定义的restful接口以及
/actuator/prometheus,看是否正常工作
- 访问一些我们定义的restful接口以及
部署到docker swarm集群
-
编辑stack文件
$ cd /opt/k8s/prometheus $ cat> sb-prom-stack.yml<<EOF version: "3" services: sbprometheus: image: sb-prometheus:0.0.1 networks: - mcsas-network deploy: restart_policy: condition: on-failure networks: mcsas-network: external: true EOF -
启动服务
$ docker stack deploy -c sb-prom-stack.yml sbprom
修改Prometheus的file_sd_configs中配置的文件
在[Prometheus 监控Docker Swarm](Prometheus 监控Docker Swarm.md)中,我们在prometheus的配置文件中指定了如下配置段:
- job_name: 'springboot'
  metrics_path: /actuator/prometheus
  file_sd_configs:
  - files:
	 - /etc/prometheus/service.yaml
所以只用在挂载目录下创建service.yaml,并追加我们要监控的服务即可
$ cd /opt/k8s/prometheus/conf
$ cat>service.yaml<<EOF
- targets: ['sbprometheus:8080']
EOF
修改完成后,通过Prometheus服务暴露的端口查看指标分类,可以发现我们自定义的业务指标已经被Prometheus获取到
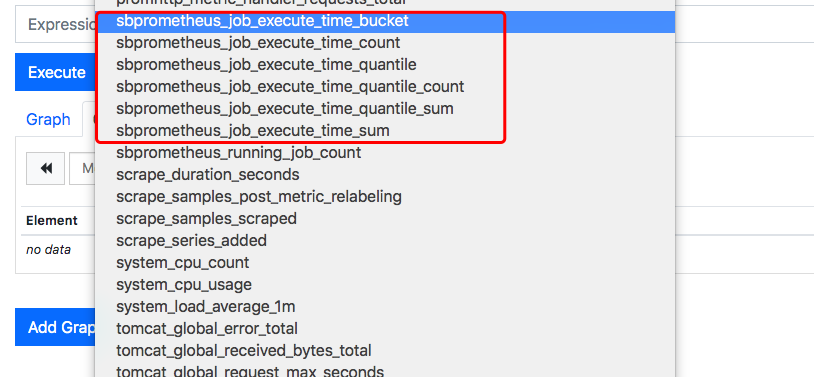
因为我们业务容器没有暴露出来端口,所以为了演示,进入容器内部,通过wget访问我们的restful接口,产生一些指标数据
$ docker ps |grep sbprometheus
8dbafd80573b        sb-prometheus:0.0.1                               "/bin/sh -c ./start.…"   44 minutes ago      Up 44 minutes                               sbprom_sbprometheus.1.kuzpe4he7j2iz9i43cwrrxh3x
$ docker exec -it 8dbafd80573b sh
/usr/src # wget -q -O - http://localhost:8080/summary/66
/usr/src # wget -q -O - http://localhost:8080/counter/tranform
/usr/src # wget -q -O - http://localhost:8080/counter/sub
/usr/src # wget -q -O - http://localhost:8080/histogram/1
/usr/src # wget -q -O - http://localhost:8080/histogram/3.4
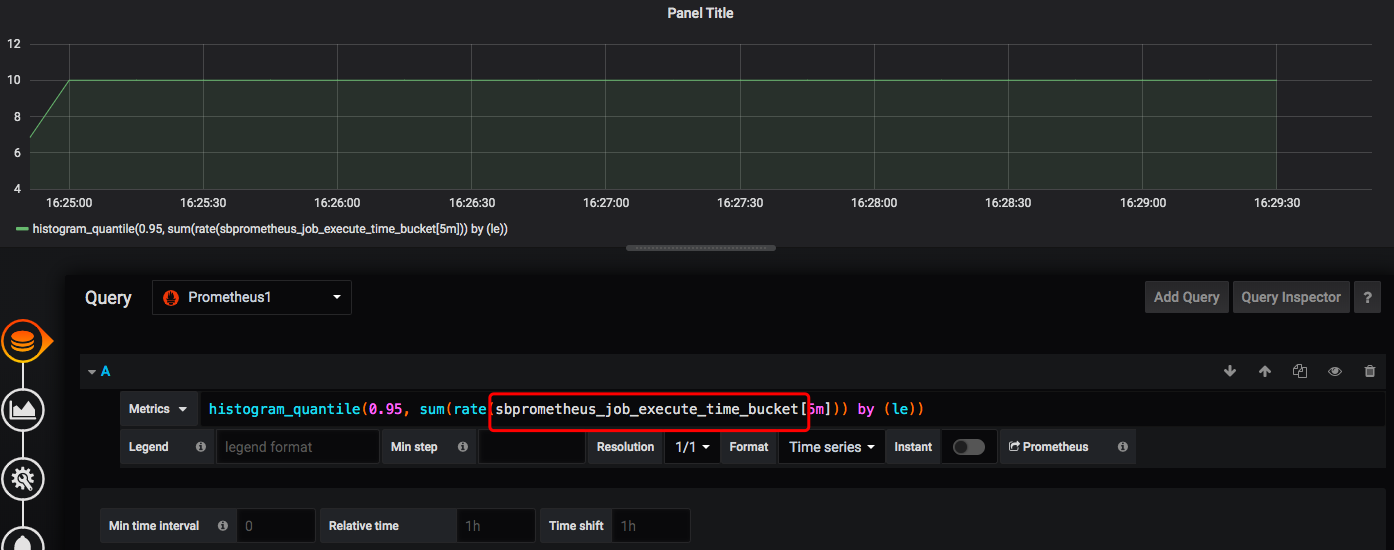
进入grafana配置dashboard
在grafana中可以对我们的业务指标进行观察如:
也可以通过cAdvisor对我部署的这个服务对应的容器进行观察


 浙公网安备 33010602011771号