
python疫情爆发至2020年5月全球疫情数据可视化
一、选题背景
从疫情的爆发大家到现在,大家每天都在关注这疫情的相关情况,对此我想对这次疫情情况进行一次分析,让大家更直观的看到从疫情爆发到2020年5月份的全球疫情相关情况。了解中国以至全球的疫情情况。
二、爬虫方案设计
1. 爬虫名称
全球疫情数据可视化
2、数据来源
目标网站是腾讯新闻
2. 爬取内容与数据特征分析
一、分析网站
二、发送网络请求并获取数据
三、将每个国家的疫情数据提取出来,包括国家名称、确诊人数、死亡人数、报告日期等等,保存在数组
四、打包数组并绘制图片
三、网站页面结构分析
通过浏览器“审查元素”查看源代码如下图所示:
<!DOCTYPE html>
<html>
    <head>
        <meta charset="utf-8">
        <title>疫情可视化系统</title>
    </head>
    <body>
        <p><h2 style="color:#fff000;">--------基于Python爬虫的疫情数据可视化系统(xx)--------</h2></p>
        <table width="820" border="0">
            <tr>
                <td style="background-color:#eeeeee;width:250px;width:400px;vertical-align:top;">
                    <b>全球疫情地图</b>
                    <a href="http://ci.jinmensuyin.com/user/201712300020/files/20200531/world1.html?_xsrf=2%7C55b64f9e%7C02ba08c5ec7be9f551b77d0531315ec8%7C1590286606" >
                    <img border="0" src="http://ci.jinmensuyin.com/user/201712300020/files/20200531/world1.png?_xsrf=2%7C55b64f9e%7C02ba08c5ec7be9f551b77d0531315ec8%7C1590286606" alt="世界地图1" width="400" height="230"></a>
                </td>

                <td style="background-color:#eeeeee;height:250px;width:400px;vertical-align:top;">
                    <b>全球疫情柱状图</b>
                    <a href="http://ci.jinmensuyin.com/user/201712300020/files/20200531/world2.html?_xsrf=2%7C55b64f9e%7C02ba08c5ec7be9f551b77d0531315ec8%7C1590286606" >
                    <img border="0" src="http://ci.jinmensuyin.com/user/201712300020/files/20200531/world2.png?_xsrf=2%7C55b64f9e%7C02ba08c5ec7be9f551b77d0531315ec8%7C1590286606" alt="世界地图2" width="400" height="230"></a>
                </td>
            </tr>

            <tr>
                <td style="background-color:#eeeeee;width:250px;width:400px;vertical-align:bottom;">
                    <b>中国疫情地图</b>
                    <a href="http://ci.jinmensuyin.com/user/201712300020/files/20200531/China1.html?_xsrf=2%7C55b64f9e%7C02ba08c5ec7be9f551b77d0531315ec8%7C1590286606">
                    <img border="0" src="http://ci.jinmensuyin.com/user/201712300020/files/20200531/China1.png?_xsrf=2%7C55b64f9e%7C02ba08c5ec7be9f551b77d0531315ec8%7C1590286606" alt="中国地图1" width="400" height="230"></a>
                </td>

                <td style="background-color:#eeeeee;height:250px;width:400px;vertical-align:bottom;">
                    <b>中国疫情饼状图</b>
                    <a href="http://ci.jinmensuyin.com/user/201712300020/files/20200531/China2.html?_xsrf=2%7C55b64f9e%7C02ba08c5ec7be9f551b77d0531315ec8%7C1590286606">
                    <img border="0" src="http://ci.jinmensuyin.com/user/201712300020/files/20200531/China2.png?_xsrf=2%7C55b64f9e%7C02ba08c5ec7be9f551b77d0531315ec8%7C1590286606" alt="中国地图2" width="400" height="230"></a>
                </td>
            </tr>


        </table>
    </body>
</html>
四、程序设计
1.导入python库
 1 import requests
 2 import jsonpath
 3 import json
 4
 5 import pyecharts
 6 from pyecharts.charts import Map
 7 from pyecharts import options as opts
 8
 9 # from countries_ch_to_en import countries_dict
10
11 from pyecharts.globals import CurrentConfig, NotebookType
12 CurrentConfig.NOTEBOOK_TYPE = NotebookType.JUPYTER_LAB
13
14 # Bar - Bar_rotate_xaxis_label
15 # http://gallery.pyecharts.org/#/Bar/bar_rotate_xaxis_label
2.目标网站 来自腾讯新闻
1 #url='https://api.inews.qq.com/newsqa/v1/automation/foreign/country/ranklist'
2 url = 'https://view.inews.qq.com/g2/getOnsInfo?name=disease_h5'
3.发送网络请求
1 resp=requests.get(url)
2 #print("data=",resp.text)
4.提取数据 类型转换 json-->dict
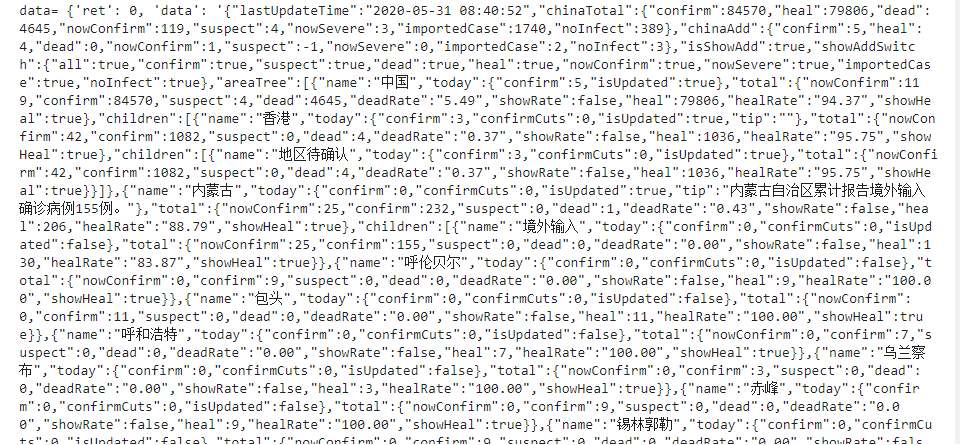
data=json.loads(resp.text)
# print("data=",data)
data = json.loads(data['data'])

date = jsonpath.jsonpath(data,"$..lastUpdateTime") #时间
#print("date:",date)

#print("data=",data)
data = data['areaTree']
#print("data=",data)
#data = data['children']
#print("data=",data)
- 中国数据原始:
- 中国省份数据:
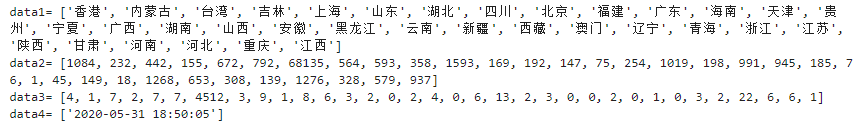
5.将每个国家的疫情数据提取出来,包括国家名称、确诊人数、死亡人数、报告日期等等,保存在数组
name = jsonpath.jsonpath(data,"$[*].children[*].name")
confirm = jsonpath.jsonpath(data,"$[*].children[*].total..confirm")
dead = jsonpath.jsonpath(data,"$[*].children[*].total..dead")

print("data1=",name)
print("data2=",confirm)
print("data3=",dead)
print("data4=",date)
#print("date_Min,date_Max=",min(date),max(date))
#date_Max=max(date)
6.将数据按照绘图模块的格式要求将数组打包
data_zip = zip(name,confirm)
data_list=list(data_zip)
print("data3=",data_list)
#时间数据特殊处理一下
#date_string="2020."+str(date_Max)
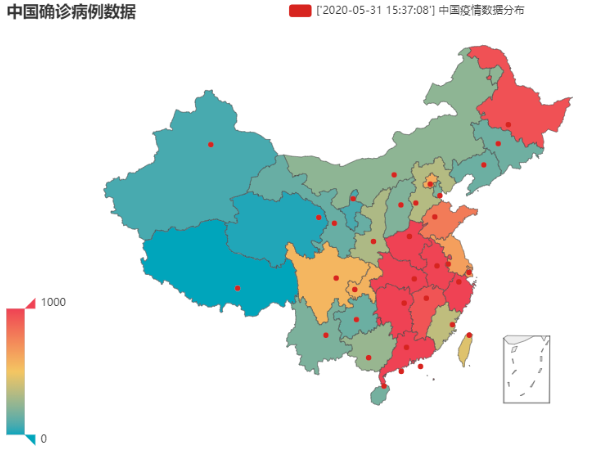
7.使用pyechart模块将疫情数据绘制在世界地图上
# 生成一个Map类的对象map
map = Map()
#向map对象添加数据
map.add(str(date)+" 全国疫情数据分布", data_list, maptype="china")

# 设置显示的参数,连续型显示
map.set_global_opts(title_opts=opts.TitleOpts(title="全国确诊病例数据"), visualmap_opts=opts.VisualMapOpts(max_=1000))
map.set_series_opts(label_opts=opts.LabelOpts(is_show=False))
8.绘图
# 疫情数据生成html网页格式呈现
map.render("China1.html")
# 疫情数据生成jupyter notebook内部的网页格式呈现

map.load_javascript()
#map.render_notebook()
# wolrd_data()
map.render_notebook()
- 绘图结果:
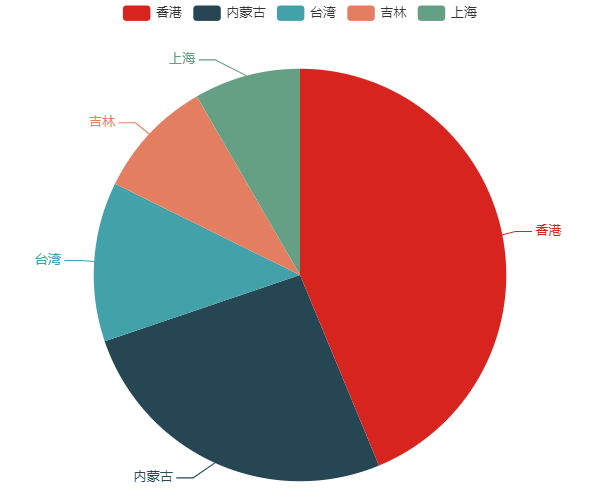
全国疫情饼状图
nowConfirm = jsonpath.jsonpath(data,"$[*].children[*].total..nowConfirm")

# 将数据按照绘图模块的格式要求将数组打包
data5_zip = zip(name,nowConfirm)
data5_list=list(data5_zip)

print("data5=",data5_list[0:5])

from pyecharts.charts import Pie
from pyecharts import options as opts
from pyecharts.globals import ThemeType

data5_list.sort(reverse=True,key=lambda x:x[1])

pie = Pie(init_opts = opts.InitOpts())
pie.add(str(date)+"全国现存确诊疫情饼状图", data5_list[0:5])
pie.render("China2.html")
pie.load_javascript()
pie.render_notebook()
- 绘图结果:
世界疫情-世界疫情图
1.目标网站 来自腾讯新闻
url='https://api.inews.qq.com/newsqa/v1/automation/foreign/country/ranklist'
2.发送网络请求
resp=requests.get(url)
#print("data=",resp.text)
3.提取数据 类型转换 json-->dict
data=json.loads(resp.text)
#print("data=",data)
- 世界地图原始:

4.将每个国家的疫情数据提取出来,包括国家名称、确诊人数、死亡人数、报告日期等等,保存在数组
name = jsonpath.jsonpath(data,"$..name")
confirm = jsonpath.jsonpath(data,"$..confirm")
dead = jsonpath.jsonpath(data,"$..dead")
date = jsonpath.jsonpath(data,"$..date")
newConfirm = jsonpath.jsonpath(data,"$..confirmAdd")
#print("data1=",name)
#print("data2=",confirm)

print("date_Min,date_Max=",min(date),max(date))
date_Max=max(date)
5.补充中国的数据
# 2.目标网站  来自腾讯新闻
#url='https://api.inews.qq.com/newsqa/v1/automation/foreign/country/ranklist'
url1 = 'https://view.inews.qq.com/g2/getOnsInfo?name=disease_h5'
# 3.发送网络请求
resp1=requests.get(url1)
#print("data=",resp.text)
# 4.提取数据   类型转换 json-->dict
datac=json.loads(resp1.text)

datac = json.loads(datac['data'])
datec = jsonpath.jsonpath(datac,"$..lastUpdateTime") #时间
#print("data=",datac)

cConfirm = jsonpath.jsonpath(datac,"$..chinaTotal..confirm")
cDead = jsonpath.jsonpath(datac,"$..chinaTotal..dead")
cnewConfirm = jsonpath.jsonpath(datac,"$..chinaAdd..confirm")
cnewDead = jsonpath.jsonpath(datac,"$..chinaAdd..confirm")
print("cConfirm:",cConfirm)
print("cnewConfirm:",cnewConfirm)
print("cDead:",cDead)
6.将数据按照绘图模块的格式要求将数组打包
data_zip = zip(name,confirm)
data_list=list(data_zip)

data_list.append(('中国', cConfirm))
#print(data_list)
#print("data3=",data_list)

#时间数据特殊处理一下
date_string="2020."+str(date_Max)
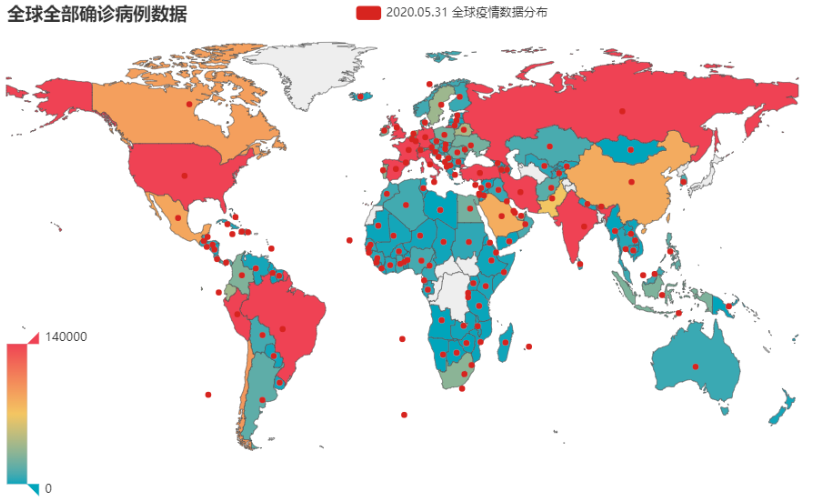
7.使用pyechart模块将疫情数据绘制在世界地图上
# 生成一个Map类的对象map
map = Map()
#向map对象添加数据
map.add(date_string+" 全球疫情数据分布", data_list, maptype="world", name_map=countries_dict)

# 设置显示的参数,连续型显示
map.set_global_opts(title_opts=opts.TitleOpts(title="全球全部确诊病例数据"), visualmap_opts=opts.VisualMapOpts(max_=140000))
map.set_series_opts(label_opts=opts.LabelOpts(is_show=False))
8.绘图
# 疫情数据生成html网页格式呈现
map.render("world1.html")
# 疫情数据生成jupyter notebook内部的网页格式呈现
map.load_javascript()
# wolrd_data()
map.render_notebook()
- 绘图结果:
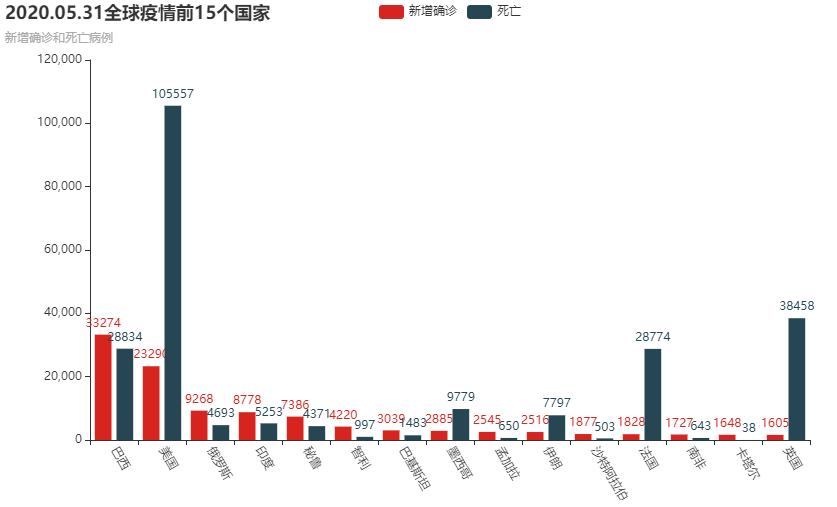
全球新增确诊和死亡人数柱状图
data3_list=list(zip(name,newConfirm,dead))
data3_list.append(('中国', cnewConfirm[0],cDead[0]))
print(data3_list[-5:])
data3_list.sort(reverse=True,key=lambda x:x[1])
from pyecharts.charts import Bar
bar=Bar()
number=15
countrys=[]
values=[]
deads=[]
MaxValue=0
# for i in range(len(all_data)):
for i in range(number):
u = data3_list[i]
countrys.append(u[0])
values.append(u[1])
deads.append(u[2])
bar.add_xaxis(countrys)
bar.add_yaxis("新增确诊", values)
bar.add_yaxis("死亡", deads)
bar.set_global_opts(
xaxis_opts=opts.AxisOpts(axislabel_opts=opts.LabelOpts(rotate=-60)),
title_opts=opts.TitleOpts(title=date_string+"全球疫情前"+str(number)+"个国家", subtitle="新增确诊和死亡病例"),
)
 bar.render("world2.html")
 bar.render_notebook()
- 绘图结果:
五、总结
本文分析了中国从疫情爆发到2020年5月31号的疫情相关情况和全球从疫情爆发到2020年5月31号的疫情相关情况,通过疫情期间确诊人数、治愈人数以及死亡人数的变化情况及趋势,可以发现中国疫情爆发之前到2020年5月的全国疫情情况和疫情严重的省份的疫情相关情况。还分析了全球从疫情爆发到2020年5月31号的全球新增确诊和死亡人数。

