编程计算定投黄金的收益率
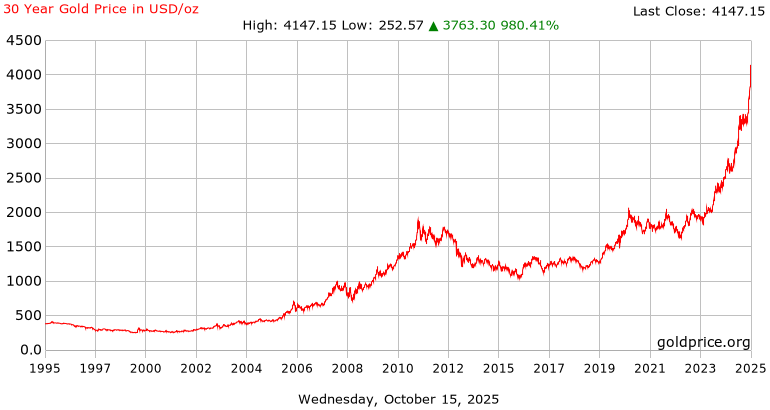
首先用Bing搜gold price,得到下图:
然后用Gwenview, IrfanView等裁剪图片,得到下图:
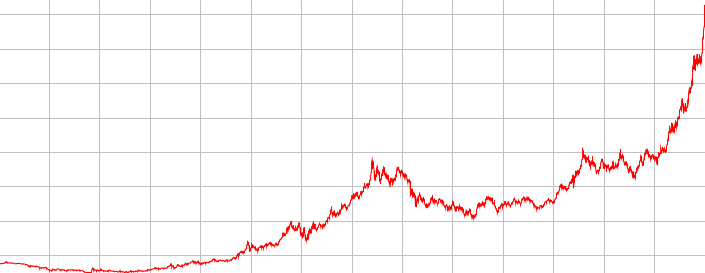
裁多了。应正好裁外框——可用opencv的演示程序squares.py :-)
然后用程序找出红线上各点坐标。如果提取红色通道,由于白是(255,255,255),红是(255,0,0),就分不清了。所以我们提取绿色通道。绿色代表下跌,一般没人用。提取后再画出来,如下图:
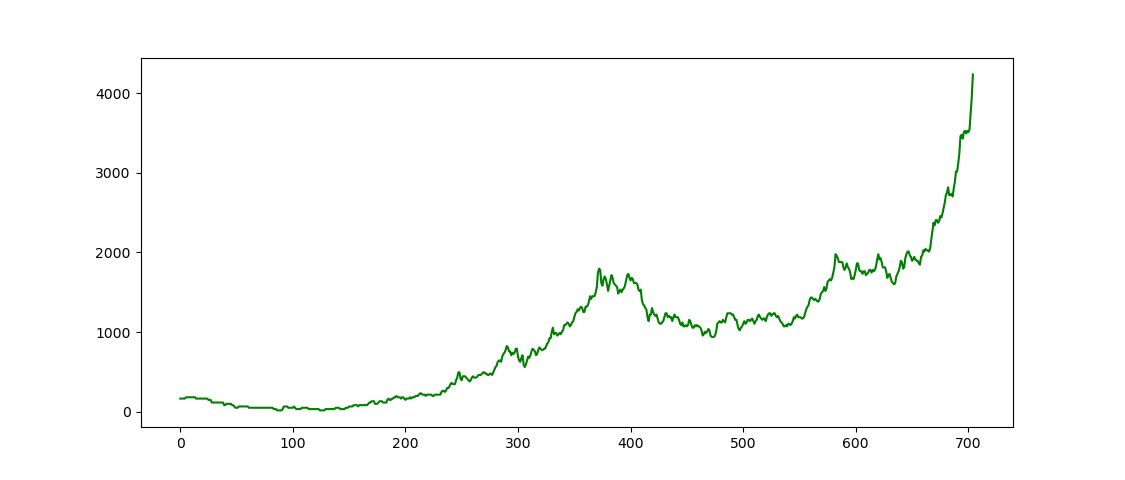
差不多与原图一致。注意y要从[0,height)缩放为原图的,比如[0,4500)。然后假设每期投1000元,计算结果是:
总投入:705000
总份额:4314.979
收益率:24.9倍 2492.82%
1995年,北京外销商品房均价2~3万元/㎡(按当时汇率1:8折算),普通住宅因福利分房制度主导,市场交易极少。向个人出售的商品住宅的平均价格为2427元/㎡,但实际可购渠道受限,单位团购仍是主流。区域差异明显,二环内商品房售价6500-8000元/㎡,四环外近郊区约2500-4500元/㎡。同期煎饼果子价格约1.5元/套(基础款)。
可完美处理天天基金网的多种颜色线。
程序(写完才知道有Image.histogram; ImageDraw.floodfill, Image.getbbox):


import sys
import numpy as np
from PIL import Image

img = Image.open(sys.argv[1])
# If用红色通道,红和白都是白,所以用绿
ary = np.array(img.split()[1]) >> 4

'''
ue, counts = np.unique(ary, return_counts=True)
sorted_indices = np.argsort(-counts)
r = ue[sorted_indices], counts[sorted_indices]
[15,     12,   0,    14...]
[179351, 9084, 1715, 411...]
So 0 the color is.
'''

data = []; height,width = ary.shape
for x in range(width):
  points = np.where(ary[:, x][:] <= 5)[0]
  n = len(points)
  if n == 0:
    print('Point missing')
    if len(data): data.append(data[-1])
  else:
    data.append(height - points[n // 2])

# 图不一样时要换4500这个高度
data = np.array(data) / height * 4500

import matplotlib.pyplot as plt
plt.plot(data, color='green')
plt.show()

# 705 705,最好相等
n = len(data); print(n, width)

z = data # 净值(zhi)
c = n  * [1000] # capital
sum_c = sum(c)
print(f'总投入:{sum_c}')
sum_s = 0 # sum_share
for i in range(n): sum_s += c[i] / z[i]
print(f'总份额:{sum_s:.3f}')
# 份额×末期净值 - 投入
ret = sum_s * z[-1] - sum_c
print(f'收益率:{ret/sum_c:0.1f}倍 {100*ret/sum_c:.2f}%')

 浙公网安备 33010602011771号