ggplot2 多图排版
和R自带的绘图系统不同,ggplot2不能直接通过par(mfrow) 或者 layout()来排版多张图片。终于发现,其实可以通过一个『gridExtra』包来搞定:
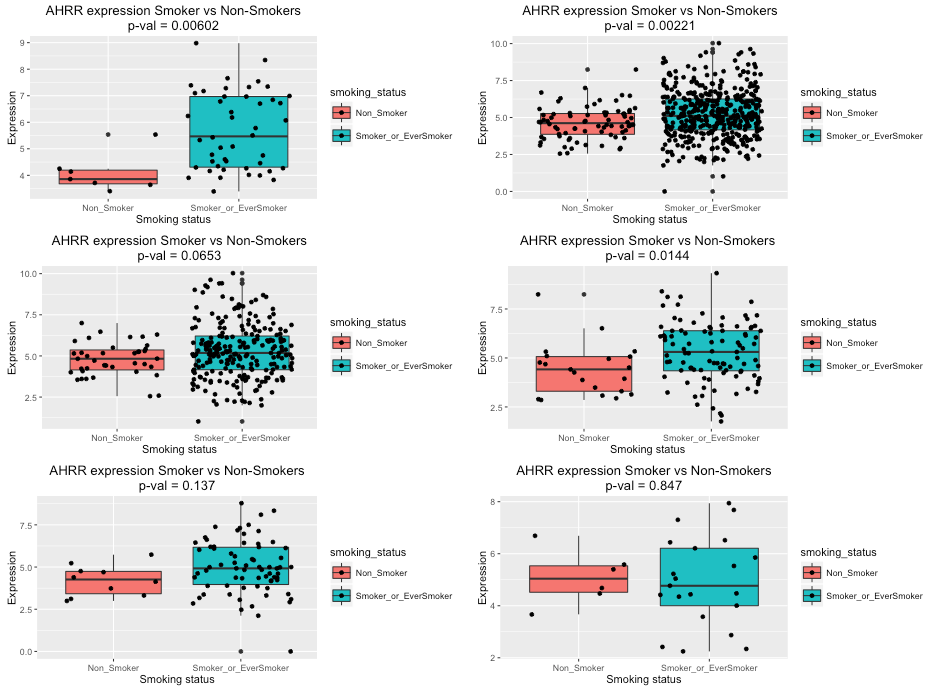
require(gridExtra)
plot1 <- Make_Smoking_Plot_TCGA("CLDN18", type = "Normal")
plot2 <- Make_Smoking_Plot_TCGA("CLDN18", type = "Tumor")
plot3 <- Make_Smoking_Plot_TCGA("CLDN18", type = "Tumor", exp_data = Expression_TvN_TCGA_Sel1)
plot4 <- Make_Smoking_Plot_TCGA("CLDN18", type = "Tumor", exp_data = Expression_TvN_TCGA_Sel2)
plot5 <- Make_Smoking_Plot_TCGA("CLDN18", type = "Tumor", exp_data = Expression_TvN_TCGA_Sel3)
plot6 <- Make_Smoking_Plot_TCGA("CLDN18", type = "Tumor", exp_data = Expression_TvN_TCGA_Sel4)
grid.arrange(plot1, plot2, plot3, plot4, plot5, plot6, ncol=2)
Reference: http://rstudio-pubs-static.s3.amazonaws.com/2852_379274d7c5734f979e106dcf019ec46c.html
posted on 2016-11-19 06:24 Forever_YCC 阅读(5596) 评论(0) 收藏 举报


 浙公网安备 33010602011771号