import tensorflow as tf
import numpy as np
import pandas as pd
import matplotlib.pyplot as plt
from sklearn.model_selection import train_test_split
from sklearn import preprocessing
def init_weights(shape):
return tf.Variable(tf.random_normal(shape, stddev=0.01))
# 创建分割线
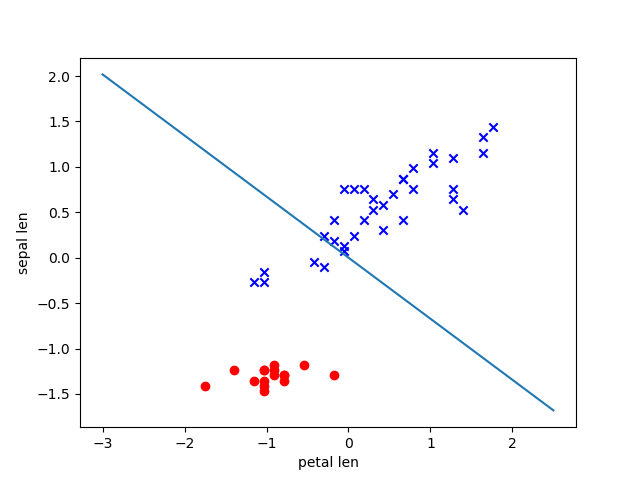
def plotLine(slope, bias):
x = np.arange(-3, 3, 0.5)
y = x * slope + bias
plt.plot(x, y)
if __name__ == "__main__":
# 导入数据
df = pd.read_csv('https://archive.ics.uci.edu/ml/machine-learning-databases/iris/iris.data', header=None)
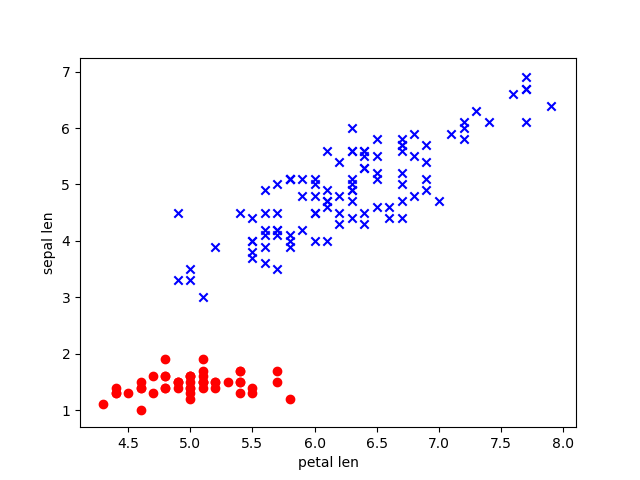
features = df.iloc[1:len(df.index), [0, 2]].values
labels = df.iloc[1:len(df.index), 4].values
# 调节数据
scaler = preprocessing.StandardScaler().fit(features)
features_standard = scaler.transform(features)
# 选取了两种花的两类特征
for index, label in enumerate(labels):
if label == "Iris-setosa":
plt.scatter(features[index, 0], features[index, 1], color='red', marker='o', label='setosa')
else:
plt.scatter(features[index, 0], features[index, 1], color='blue', marker='x', label='versicolor')
plt.xlabel('petal len')
plt.ylabel('sepal len')
plt.show()
# 转换标签
labels = np.where(labels == "Iris-setosa", 1, -1)
# 使用sklearn类库快速分割数据集
features_train, features_test, labels_train, labels_test = \
train_test_split(features_standard, labels, test_size=0.33)
X = tf.placeholder(tf.float32)
Y = tf.placeholder(tf.float32)
w = init_weights([2, 1])
b = tf.Variable(tf.zeros([1, 1]))
predict_Y = tf.sign(tf.matmul(X, w) + b)
loss = tf.reduce_mean(tf.square(predict_Y - labels_train))
optimizer = tf.train.GradientDescentOptimizer(0.01)
train_step = optimizer.minimize(loss)
init = tf.global_variables_initializer()
sess = tf.Session()
sess.run(init)
# start train
for i in range(1000):
sess.run(train_step, feed_dict={X: features_train, Y: labels_train})
w1 = sess.run(w).flatten()[0]
w2 = sess.run(w).flatten()[1]
b = sess.run(b).flatten()
for index, label in enumerate(labels_test):
if label == 1:
plt.scatter(features_test[index, 0], features_test[index, 1], color='red', marker='o', label='setosa')
else:
plt.scatter(features_test[index, 0], features_test[index, 1], color='blue', marker='x', label='versicolor')
plt.xlabel('petal len')
plt.ylabel('sepal len')
plotLine(-w1 / w2, -b / w2)
plt.show()

 浙公网安备 33010602011771号