
利用 R 绘制拟合曲线
Table of Contents
利用 R 绘制拟合曲线
个人主要使用 ggplot2 进行绘图,这里也只介绍 ggplot2 的相关方法。
利用 R 绘制拟合曲线主要有两类方法:
- 利用 geom_smooth 进行曲线的拟合(method 选择 loess 或者添加 formula);
- 利用 spline 进行插值操作,然后用 geom_line 进行连接。
但是,这两种方法都有一些缺陷。利用 geom_smooth 进行曲线的拟合在某些数据的情况下会拟合比较差,甚至呈现折线。利用 spline 进行插值操作后绘图会导致曲线必须经过实际值对应的点,导致曲线僵硬。在某些情况下,两种方法都无法得到我们需要的图形。
在本文中,需要绘制如下数据的图形:
| density | ROS |
| 0 | 3.43 |
| 0.001 | 1.86 |
| 0.01 | 56.00 |
| 0.1 | 225.31 |
| 1 | 183.56 |
| 10 | 339.40 |
| 100 | 272.89 |
| 1000 | 204.17 |
| 10000 | 2.29 |
该数据表现了样品随着浓度的变化,观测值变化的情况。
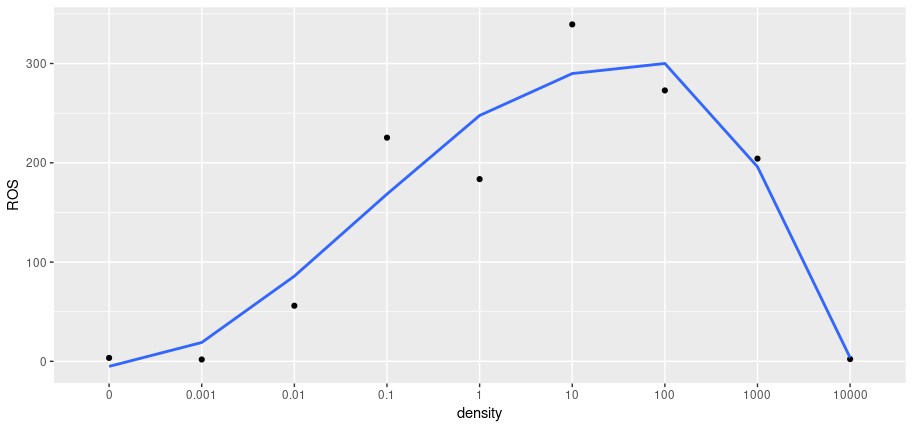
单纯使用 goem_smooth
    library(ggplot2)
    ros <- read.csv('tem.csv', colClasses = c('character', 'numeric'))
    ros <- transform.data.frame(ros, density2 = 1:9)
    ggplot(ros, aes(x=density, y=ROS)) +
      geom_point() +
      geom_smooth(aes(x=density2, y=ROS), se = F, method = 'loess')
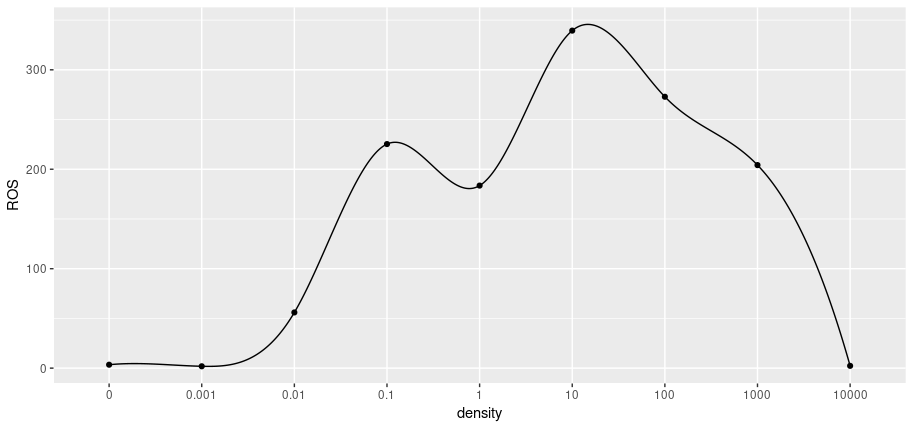
单纯使用 spline
    ros <- transform.data.frame(ros, density2=1:9)
    tem <- as.data.frame(spline(ros$density2, ros$ROS, n=10000))
    ggplot(ros, aes(x=density, y=ROS)) +
      geom_point() +
      geom_line(data = tem, aes(x=x, y=y))
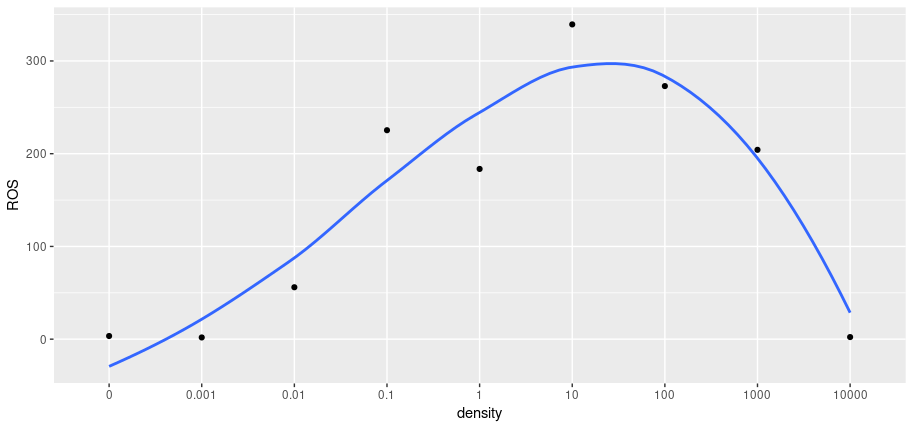
同时使用前两种方法
    tem2 <- as.data.frame(spline(ros$density2, ros$ROS, n=100))
    ggplot(ros, aes(x=density, y=ROS)) +
      geom_point() +
      geom_smooth(data = tem2, aes(x=x, y=y), se = F, method = 'loess')

 浙公网安备 33010602011771号