The Impact of Disks on RocksDB State Backend in Flink: A Case Study
As covered in a recent blog post, RocksDB is a state backend in Flink that allows a job to have state larger than the amount of available memory as the state backend can spill state to local disk. This means disk performance may have an impact on the performance of Flink jobs using RocksDB. Through a case study, this blog post illustrates a throughput drop problem of a Flink job using RocksDB and demonstrates how we identified the performance of the underlying disk as the root cause.
Job and Execution Environment
We were dealing with a typical Internet of Things (IoT) job that processes a stream of events emitted from millions of devices. Each event contains a device identifier (ID), an event type, and the timestamp when the event was generated. The job partitions the stream based on the device ID and stores in state a mapping from each event type to the latest timestamp when that type of event was received. There can be hundreds of event types. For each incoming event, the job needs to read the timestamp from state for the received event type and compare it with the incoming one. If the incoming timestamp is newer, it updates the timestamp stored in state.
The job runs on an Amazon Elastic Kubernetes Service (EKS) cluster created with the official AWS command line tool eksctl with all default settings. The Flink TaskManager is allocated with 1.5 CPU cores and 4 GB memory. The job uses the RocksDB state backend, which is configured to use Flink’s managed memory. The state.backend.rocksdb.localdir configuration option is not explicitly set, so by default the /tmp directory on the root volume of the underlying EC2 instance is used for RocksDB in-flight state (i.e. working state).
Symptoms
This job ran fine on EKS initially. But after some time — hours or days, depending on the incoming events — the job throughput suddenly dropped significantly. The drop could be easily reproduced. The throughput metrics graph below shows a drop from more than 10k events per second to a few hundred events per second shortly after 23:50 in a given day.

In addition, stopping the job with a savepoint and then resuming from it didn’t help: the job throughput remained low after the restart. Although high throughput was restored when the job was restarted from an empty state, this was not an option because (1) the job state would be lost and (2) the job throughput would drop again after a shorter period of time.
Analysis
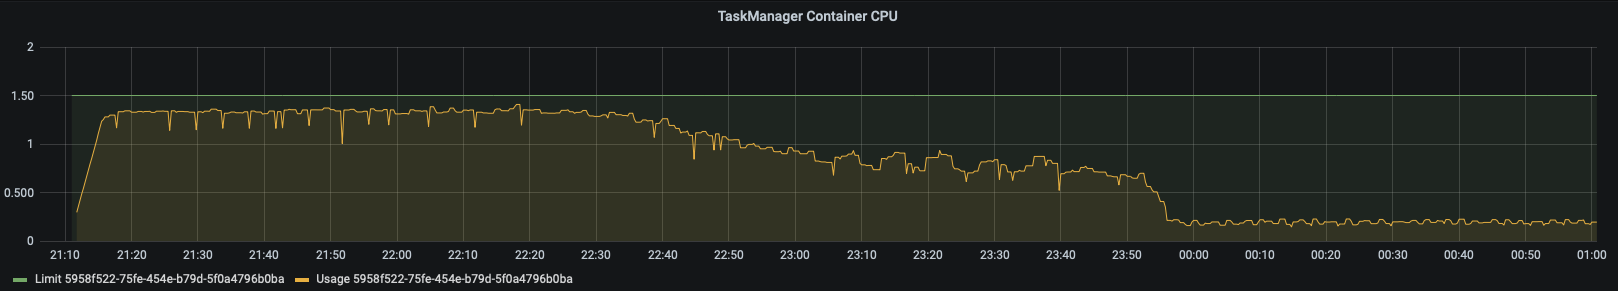
Checking the CPU metrics, we noticed that when the throughput dropped, the CPU utilization of the TaskManager container was also reduced. Since the TaskManager container can potentially use more CPU resources (same as before the throughput drop happened), the reduction of the CPU usage is rather a symptom here.
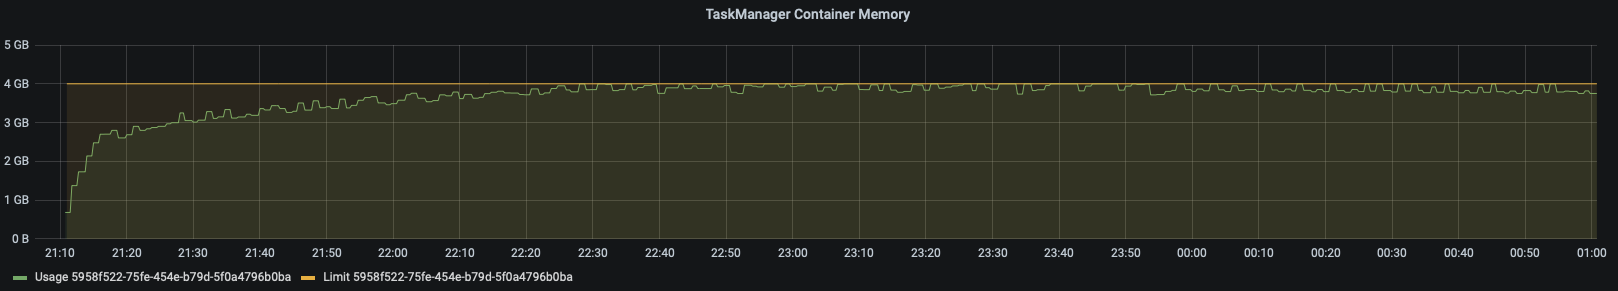
The memory usage of the TaskManager container reached the allocation limit a long time before the throughput drop happened, and it did not change significantly at around 23:50.
In order to investigate what was slowing down the job, we enabled TaskManager JMX by setting the following TaskManager JVM options:
Then we attached a local running VisualVM to the TaskManager and did a CPU sampling. As seen in the CPU sampling results below, 93% of CPU time was consumed by the thread UpdateState. This is the thread that runs the operator UpdateState, which reads and updates state in RocksDB.

Inside the UpdateState thread, as seen in the screenshot below, almost all of the CPU time was taken by the native method org.rocksdb.RocksDB.get(). This tells us that the job was bottlenecked on reading state from RocksDB.

To further investigate where RocksDB was spending its time, we enabled the following Flink RocksDB metrics:
The block cache is where RocksDB caches data in memory for reads. As seen in the following graph, the block cache was filled up quickly in the first few minutes when the job was started, mainly by the state entries. This still does not explain the sudden throughput drop at around 23:50.

|
|
When a state entry is not in the RocksDB block cache, reading it from RocksDB will involve disk IO operations. We moved ahead to check the disk metrics of the root volume. As seen in the following two graphs, the read throughput was dropped to around 230 operations per second at the time when the Flink job throughput dropped. The same happened on the write throughput, which dropped to around 10. Checking the disk Input/Output Operations Per Second (IOPS) capacity, we found that by default each EC2 instance in an EKS cluster created with eksctl is a m5.large instance coming with a general-purpose (gp2) Elastic Block Store (EBS) root volume. The root volume has a size of 80GB and delivers a baseline rate of 240 IOPS. This confirmed that the disk was saturated and the Flink job was bottlenecked on disk IO.


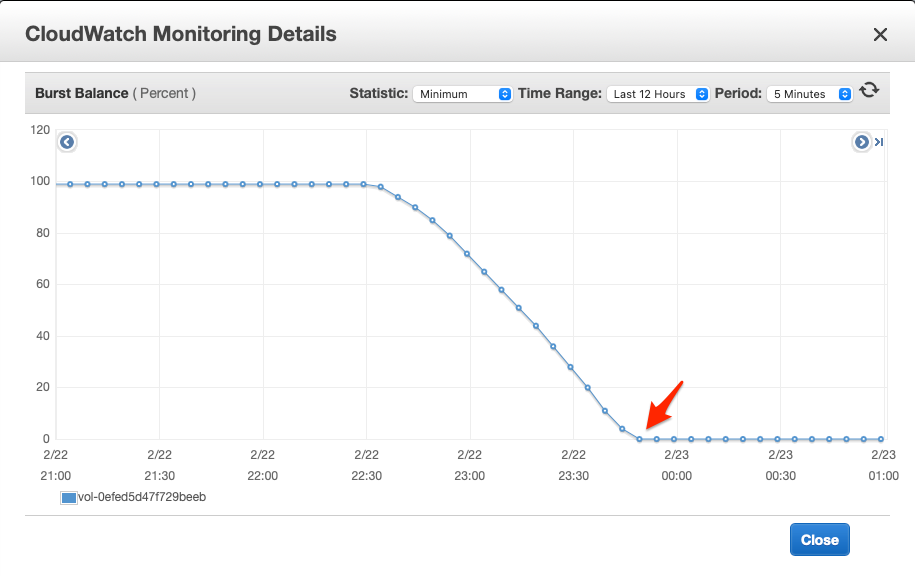
The reason we could achieve higher IOPS at the beginning was due to the initial I/O credits which AWS gives to every gp2 volume to sustain burst IO requests. The Burst Balance metrics below confirmed this: the initial I/O credits were exhausted and the burst balance dropped to 0 at the time when the issue happened. This also explains why a job restart did not help.
With the root cause identified, the solution to overcome this problem was to attach a dedicated volume with a high IOPS rate, e.g., a gp3 or io1/io2 volume and then set the Flink configuration state.backend.rocksdb.localdir to a directory on that volume.
Conclusion
This blog post described a Flink job throughput drop problem and the investigation we did to find the root cause. As we can see, the disk performance had a significant impact on the performance of the RocksDB state backend in Flink. The key takeaway here is: when using the RocksDB state backend with large state and accessing state is expected to hit disk constantly (e.g., reading state from RocksDB randomly), you should set the Flink configuration state.backend.rocksdb.localdir to a directory on a volume with a high IOPS rate. Keep in mind that burstable disks are good for jobs with bursty IO. A burstable disk may bring you sufficient performance initially but overtime its performance may drop to its baseline when the burst I/O credits are ever exhausted.

 浙公网安备 33010602011771号