(数据科学学习手札08)系统聚类法的Python源码实现(与Python,R自带方法进行比较)
聚类分析是数据挖掘方法中应用非常广泛的一项,而聚类分析根据其大体方法的不同又分为系统聚类和快速聚类,其中系统聚类的优点是可以很直观的得到聚类数不同时具体类中包括了哪些样本,而Python和R中都有直接用来聚类分析的函数,但是要想掌握一种方法就得深刻地理解它的思想,因此自己从最底层开始编写代码来实现这个过程是最好的学习方法,所以本篇前半段是笔者自己写的代码,如有不细致的地方,望指出。
一、仅使用numpy包进行系统聚类的实现:
'''以重心法为距离选择方法搭建的系统聚类算法原型'''
# @Feffery
# @说明:目前仅支持维度为2,重心法的情况

import numpy as np
import time

price = [1.1,1.2,1.3,1.4,10,11,20,21,33,34]
increase = [1 for i in range(10)]
data = np.array([price,increase],dtype='float32')


class Myhcluster():

    def __init__(self):
        print('开始进行系统聚类')
    '''系统聚类法的启动函数,有输入变量和距离计算方法两个输入参数'''
    def prepare(self,data,method='zx'):
        if method == 'zx':
            self.zx(data)
    '''重心法进行系统聚类'''
    def zx(self,data):
        token = len(data[0,:])
        flu_data = data.copy()
        classfier =[[] for i in range(len(data[1,]))]
        LSdist = np.array([0 for i in range(token ** 2)], dtype='float32').reshape([len(data[0, :]), token])
        index = 0
        while token > 1:
            '''计算距离矩阵'''
            for i in range(len(data[0,:])):
                for j in range(len(data[0,:])):
                        LSdist[i,j] = round(((flu_data[0,i]-flu_data[0,j])**2+(flu_data[1,i]-flu_data[1,j])**2)**0.5,4)

            '''将距离矩阵中的0元素替换为NAN'''
            for i in range(len(data[0,:])):
                for j in range(len(data[0,:])):
                    if LSdist[i,j] == 0:
                        LSdist[i,j] = np.nan

            '''保存该次系统聚类中最短距离对应的两个样本的标号'''
            T = set([np.argwhere(LSdist == np.nanmin(LSdist))[0,0],np.argwhere(LSdist == np.nanmin(LSdist))[0,1]])
            TT = [i for i in T]

            '''针对该次聚类情况进行产生新子类亦或是归入旧子类的选择'''
            RQ = TT
            for x in range(len(classfier)):
                if classfier[0] == []:#判断是否为n个样本中第一次迭代产生新类
                    classfier[0] = TT
                    index = 0
                    break
                elif classfier[-2] != []:#判断是否已在理论最大归类次数前完成所有样品的聚类
                    print('最后一次分类,获得由样本{}组成的新类'.format([__ for __ in range(len(data[1,]))]))
                    return 0
                elif TT[0] in classfier[x] or TT[1] in classfier[x]:
                    if classfier[x+1]==[]:
                        classfier[x+1] = list(set(classfier[x]).union(set(RQ)))
                        index = x+1
                        break
                    else:
                        RQ = list(set(classfier[x]).union(set(RQ)))
                        classfier[len(data[1,])-token] = RQ
                        continue
                elif x == len(data[1,])-1:
                    classfier[len(data[0,:])-token] = TT
                    index = len(data[0,:])-token
            print('第{}次分类,获得由样本{}组成的新类'.format(str(len(data[0,:])-token+1),set(classfier[index])))
            #求得重心并对原数据进行覆盖
            for k in set(classfier[index]):
                flu_data[0,k] = np.mean([data[0,_] for _ in set(classfier[index])])
                flu_data[1,k] = np.mean([data[1, _] for _ in set(classfier[index])])
            token -= 1


a = time.clock()
dd = Myhcluster()#进行算法封装的类的传递
dd.prepare(data)#调用类中的系统聚类法(默认重心法)
print('自己编写的系统聚类算法使用了'+str(round(time.clock()-a,3))+'秒')

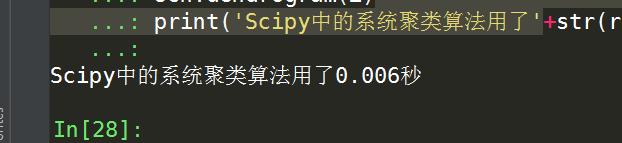
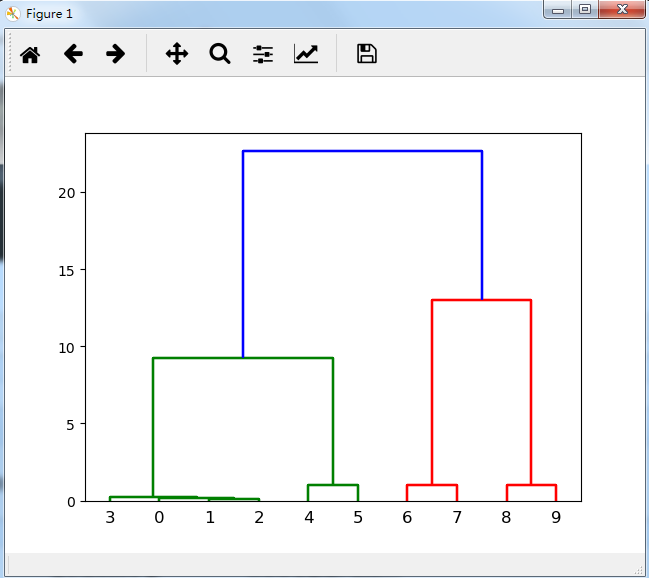
与Scipy中系统聚类方法进行比较:
'''与Scipy中自带的层次聚类方法进行比较'''
import scipy.cluster.hierarchy as sch
import numpy as np

a = time.clock()
disMat = sch.distance.pdist(data.T,'euclidean')

Z=sch.linkage(disMat,method='average')

sch.dendrogram(Z)
print('Scipy中的系统聚类算法用了'+str(round(time.clock()-a,3))+'秒')
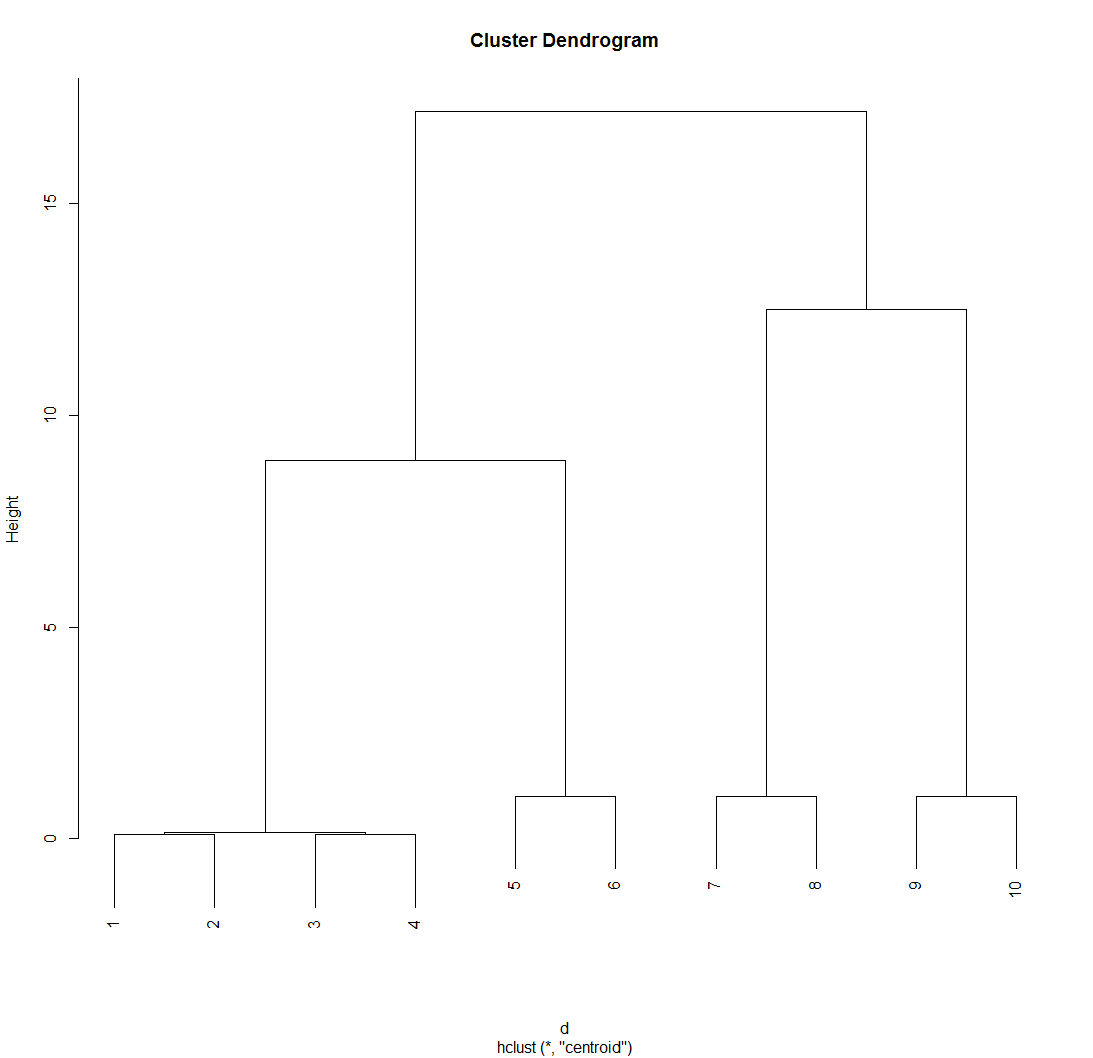
与R自带系统聚类算法进行比较:
> #系统聚类法的R实现
> rm(list=ls())
> a <- Sys.time()
> price <- c(1.1,1.2,1.3,1.4,10,11,20,21,33,34)
> increase <- rep(1,10)
> data <- data.frame(price,increase)#生成样本数据框
> d <- dist(data)#创建样本距离阵
> hc <- hclust(d,'centroid')#用重心法进行系统聚类
> cbind(hc$merge, hc$height)#展示分类过程
[,1] [,2] [,3]
[1,] -1 -2 0.10000
[2,] -3 -4 0.10000
[3,] 1 2 0.15000
[4,] -5 -6 1.00000
[5,] -7 -8 1.00000
[6,] -9 -10 1.00000
[7,] 3 4 8.93750
[8,] 5 6 12.50000
[9,] 7 8 17.18056
> Sys.time() - a
Time difference of 0.007000923 secs
> plot(hc)#绘制层次聚类图

 浙公网安备 33010602011771号