Prometheus监控安装及使用(一)
原理就不多说了,直接上操作过程吧
Prometheus Push Gateway 参考: https://github.com/prometheus/pushgateway
Prometheus Server 参考: https://github.com/prometheus/prometheus#install
Grafana 参考: http://docs.grafana.org
安装
tar -zxvf prometheus-2.8.1.linux-amd64.tar.gz -C /usr/local/
cd /usr/local
mv prometheus-2.8.1.linux-amd64/ prometheus
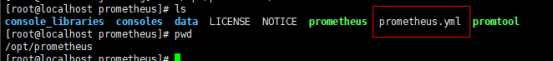
cd prometheus/
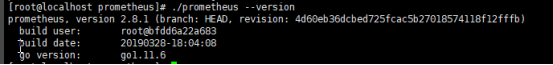
./prometheus --version
修改prometheus.yml文件,确定启动ip
修改prometheus.yml文件,确定启动ip

完成修改后,可以直接启动
./prometheus
# 添加用户,后期用此账号启动服务
[root@localhost prometheus]# groupadd prometheus
[root@localhost prometheus]# useradd -g prometheus -s /sbin/nologin prometheus
# 赋权和创建prometheus运行数据目录
[root@localhost prometheus]# cd ~
[root@localhost ~]# chown -R prometheus:prometheus /usr/local/prometheus/
[root@localhost ~]# mkdir -p /home/software/prometheus-data
[root@localhost ~]# chown -R prometheus:prometheus /home/software/prometheus-data
设置开机启动
[root@localhost ~]# touch /usr/lib/systemd/system/prometheus.service
[root@localhost ~]# chown prometheus:prometheus /usr/lib/systemd/system/prometheus.service
[root@localhost ~]# vim /usr/lib/systemd/system/prometheus.service
[Unit]
Description=Prometheus
Documentation=https://prometheus.io/
After=network.target
[Service]
# Type设置为notify时,服务会不断重启
Type=simple
User=prometheus
# --storage.tsdb.path是可选项,默认数据目录在运行目录的./dada目录中
ExecStart=/usr/local/prometheus/prometheus --config.file=/usr/local/prometheus/prometheus.yml --storage.tsdb.path=/home/software/prometheus-data
Restart=on-failure
[Install]
WantedBy=multi-user.target
修改配置文件设置开机启动
再次修改配置文件
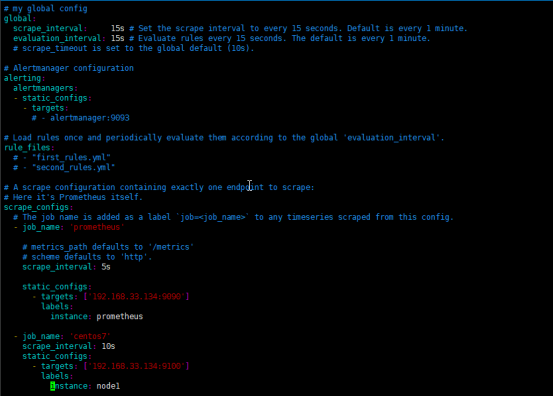
vim prometheus.yml
# my global config
global:
scrape_interval: 15s # Set the scrape interval to every 15 seconds. Default is every 1 minute.
evaluation_interval: 15s # Evaluate rules every 15 seconds. The default is every 1 minute.
# scrape_timeout is set to the global default (10s).
# Alertmanager configuration
alerting:
alertmanagers:
- static_configs:
- targets:
# - alertmanager:9093
# Load rules once and periodically evaluate them according to the global 'evaluation_interval'.
rule_files:
# - "first_rules.yml"
# - "second_rules.yml"
# A scrape configuration containing exactly one endpoint to scrape:
# Here it's Prometheus itself.
scrape_configs:
# The job name is added as a label `job=<job_name>` to any timeseries scraped from this config.
- job_name: 'prometheus'
# metrics_path defaults to '/metrics'
# scheme defaults to 'http'.
scrape_interval: 5s
static_configs:
- targets: ['192.168.33.134:9090']
labels:
instance: prometheus
- job_name: 'centos7-machine1'
scrape_interval: 10s
static_configs:
- targets: ['192.168.33.131:9100']
labels:
instance: node1
- job_name: 'centos7-machine2'
scrape_interval: 10s
static_configs:
- targets: ['192.168.33.132:9100']
labels:
instance: node2
- job_name: 'centos7-machine3'
scrape_interval: 10s
static_configs:
- targets: ['192.168.33.132:9100']
labels:
instance: node3
- job_name: 'centos7-machine4'
scrape_interval: 10s
static_configs:
- targets: ['192.168.33.134:9100']
labels:
instance: node4
- job_name: 'win2012-machine5'
scrape_interval: 10s
static_configs:
- targets: ['192.168.33.135:9182']
labels:
instance: node5
[root@prometheus ~]# systemctl enable prometheus
[root@prometheus ~]# systemctl start prometheus
设置iptables或者firewalld(测试环境可以直接关闭)
启动并验证
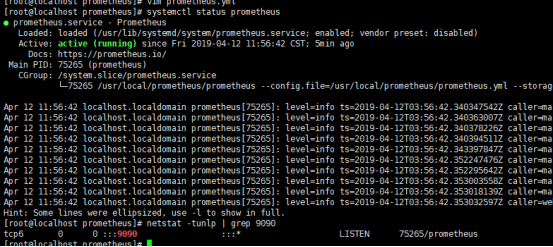
1)查看服务状态
[root@prometheus ~]# systemctl status prometheus
2)web ui
Prometheus自带有简单的UI

在Status菜单下,Configuration,Rule,Targets等,
Statu-->Configuration展示prometheus.yml的配置,如下

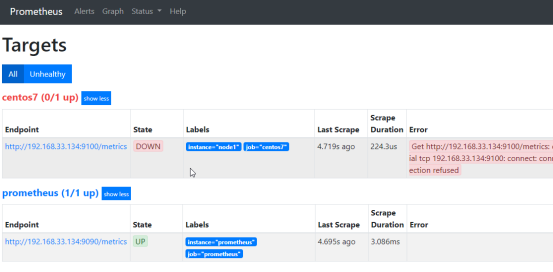
Statu-->Targets展示监控具体的监控目标
centos还没有监控到,一会安装插件

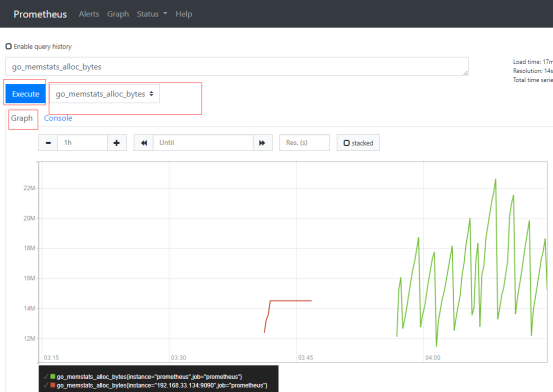
绘图
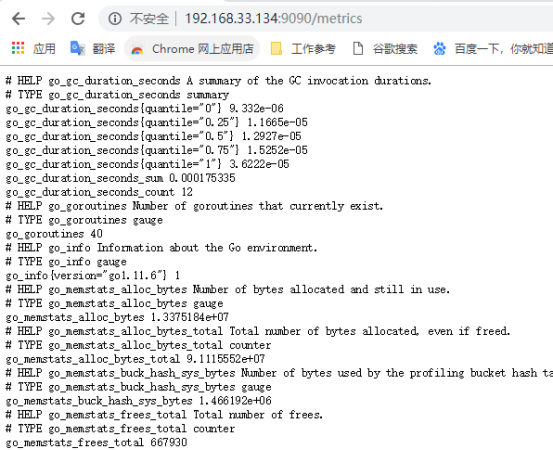
访问http://192.168.33.134:9090/metrics 查看从exporter具体能抓到的数据,如下
三.部署node_exporter
Node_exporter收集机器的系统数据,这里采用prometheus官方提供的exporter,除node_exporter外,官方还提供consul,memcached,haproxy,mysqld等exporter,具体可查看官网。
这里在prometheus服务和 node节点部署相关服务。
tar -zxvf node_exporter-0.17.0-rc.0.linux-amd64.tar.gz -C /usr/local/
cd /usr/local/
mv node_exporter-0.17.0-rc.0.linux-amd64 node_exporter
设置用户(节点)
groupadd prometheus
useradd -g prometheus -s /sbin/nologin prometheus
chown -R prometheus:prometheus /usr/local/node_exporter
[root@node1 ~]# vim /usr/lib/systemd/system/node_exporter.service
[Unit]
Description=node_exporter
Documentation=https://prometheus.io/
After=network.target
[Service]
Type=simple
User=prometheus
ExecStart=/usr/local/node_exporter/node_exporter
Restart=on-failure
[Install]
WantedBy=multi-user.target
[root@node1 ~]# systemctl enable node_exporter
[root@node1 ~]# systemctl start node_exporter
grafana安装
wget https://dl.grafana.com/oss/release/grafana-6.1.3-1.x86_64.rpm
yum -y localinstall grafana-6.1.3-1.x86_64.rpm
配置文件
配置文件位于/etc/grafana/grafana.ini,这里暂时保持默认配置即可
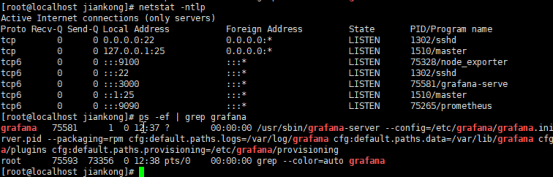
设置开机启动
systemctl enable grafana-server
systemctl start grafana-server
防火墙管理(测试环境直接关闭)
添加数据
访问:http://192.168.33.134:3000,默认账号/密码:admin/admin

默认登录后,要求改密码,可以选择先跳过
添加数据源
在登陆首页,点击"Add data source"按钮,跳转到添加数据源页面,配置如下:
Name: prometheus
Type: prometheus
Access: proxy
取消Default的勾选,其余默认,点击"Add",如下:


在"Dashboards"页签下"import"自带的模版,如下:
发现是空的
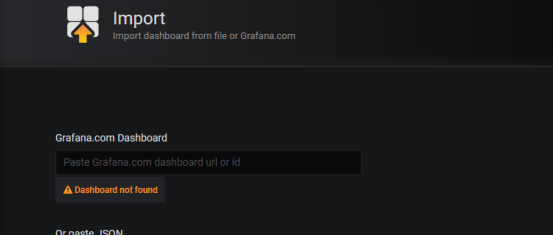
导入dashboard
从grafana官网下载相关dashboaed到本地,如:https://grafana.com/dashboards/405
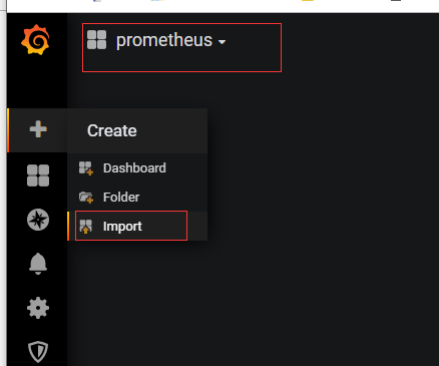
Grafana首页-->左上角图标-->Dashboard-->import
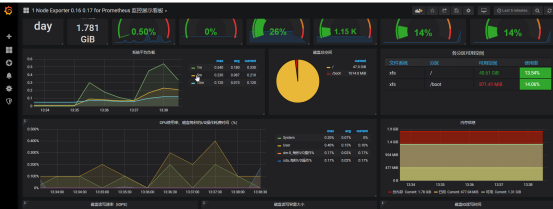
加入1-node-exporter-0-16-0-17-for-prometheus_rev7.json这个插件
如果出现grafana-piechart-panel这个报错
1.安装pie插件
官网:https://grafana.net/plugins/grafana-piechart-panel
grafana-cli plugins install grafana-piechart-panel
2.重启grafana-server
即可恢复,效果如下
现在监控正常了,我们开始把服务加入这个项目中,现在各个节点安装node_exporter-0.17.0-rc.0.linux-amd64.tar.gz
部署
[root@node1 src]# tar -zxvf node_exporter-0.17.0-rc.0.linux-amd64.tar.gz -C /usr/local/
[root@node1 src]# cd /usr/local/
[root@node1 local]# mv node_exporter-0.17.0-rc.0.linux-amd64/ node_exporter/
2. 设置用户
groupadd prometheus
useradd -g prometheus -s /sbin/nologin prometheus
chown -R prometheus:prometheus /usr/local/node_exporter/
3. 设置开机启动
[root@node1 ~]# vim /usr/lib/systemd/system/node_exporter.service
[Unit]
Description=node_exporter
Documentation=https://prometheus.io/
After=network.target
[Service]
Type=simple
User=prometheus
ExecStart=/usr/local/node_exporter/node_exporter
Restart=on-failure
[Install]
WantedBy=multi-user.target
[root@node1 ~]# systemctl enable node_exporter
[root@node1 ~]# systemctl start node_exporter
监控win主机
安装wmi_exporter-0.3.3-amd64.msi
从https://github.com/martinlindhe/wmi_exporter/releases/download/v0.3.3/wmi_exporter-0.3.3-amd64.msi
下载后,安装插件
访问http://ip:9182/metrics后,如图
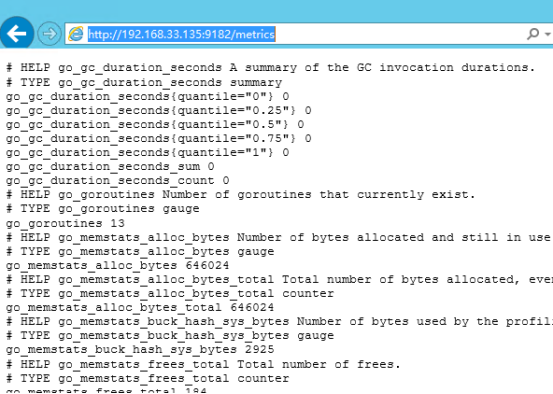
说明安装成功
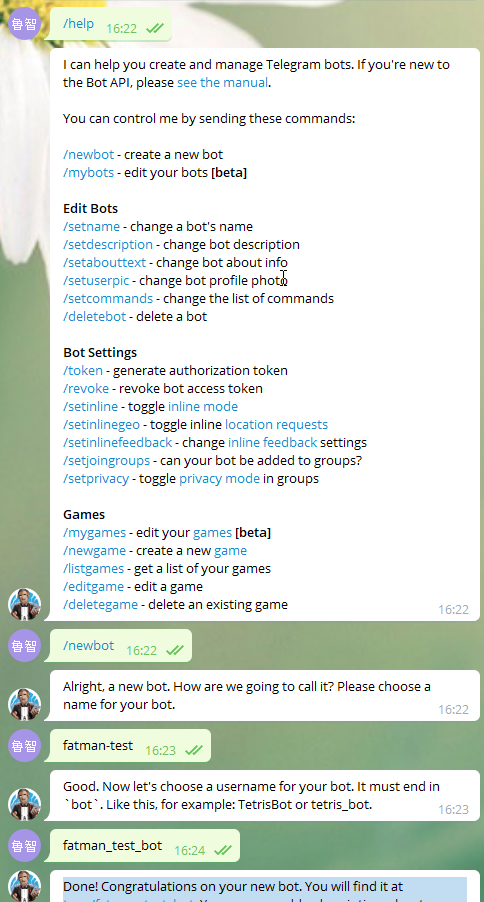
telegram报警设置
在 telegram中@BotFather,并加为好友,然后,创建你的机器人
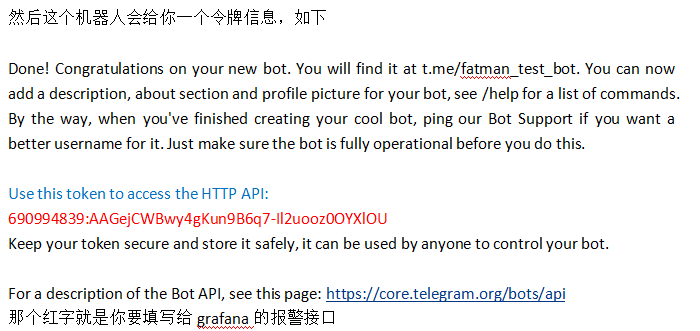

填入红色涂鸦的地方
https://api.telegram.org/bot{$token}/getUpdates
把token换成你自己刚刚注册到的那个红色标注的字符串
后连接 变成为https://api.telegram.org/bot690994839:AAGejCWBwy4gKun9B6q7-Il2uooz0OYXlOU/getMe
返回如下则成功

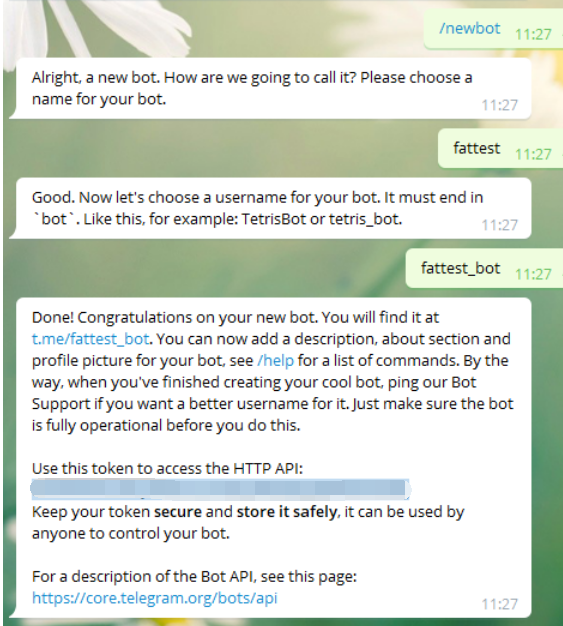
验证完毕,我们删掉这个token,重新申请一个来解决
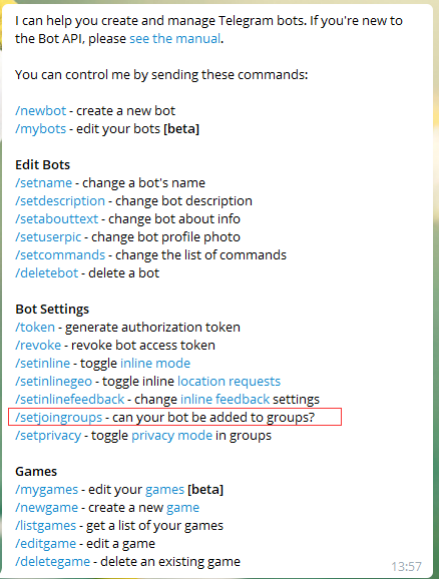
打开这个选项
然后,将这个机器人拉入报警群

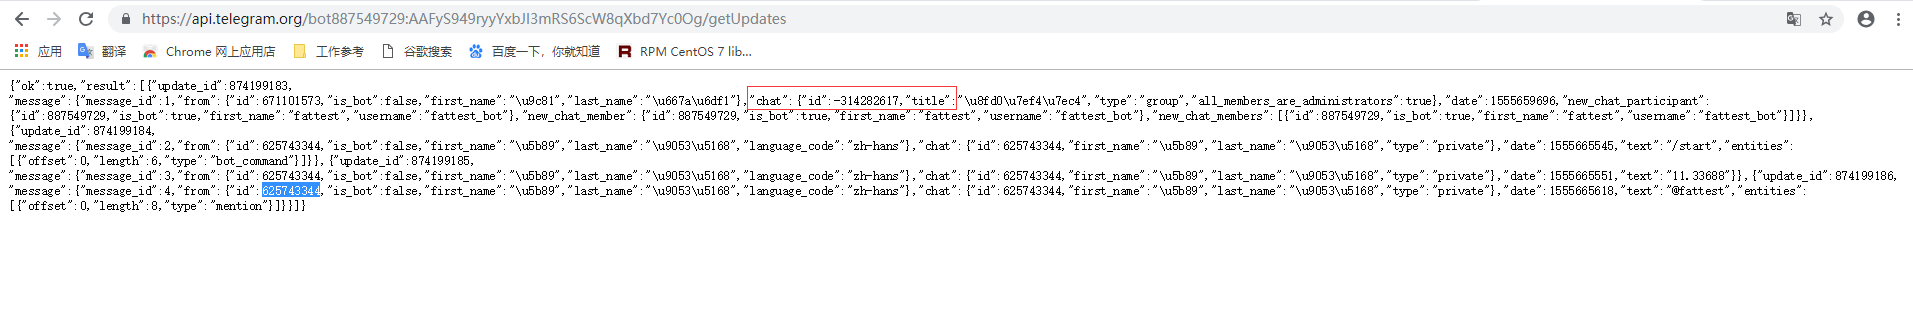
和它进行交流后,在此刷新下面的命令
https://api.telegram.org/bot887549729:AAFyS949ryyYxbJI3mRS6ScW8qXbd7Yc0Og/getUpdates
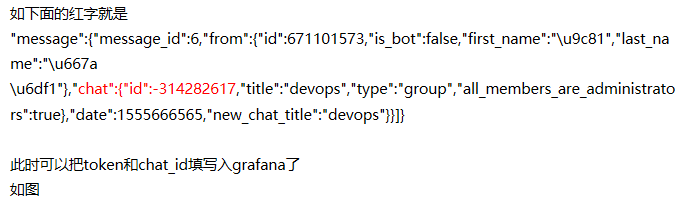
然后发现找到了chat的id


 浙公网安备 33010602011771号