
EFK日志收集系统的设计与实现

一,设计阶段
1,收集的步骤
收集 -> 分析 -> 存储 -> 后台

最简单的ELK应用架构
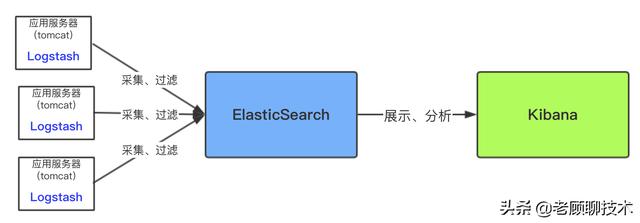
上面架构是简单粗暴的架构,这种架构对数据源服务器(即应用服务器)性能影响较大,因为Logsash是需要安装和运行在需要收集的数据源服务器(即应用服务器)中,然后将收集到的数据实时进行过滤,过滤环节是很耗时间和资源的,过滤完成后才传输到ES中。下面是优化后的架构图
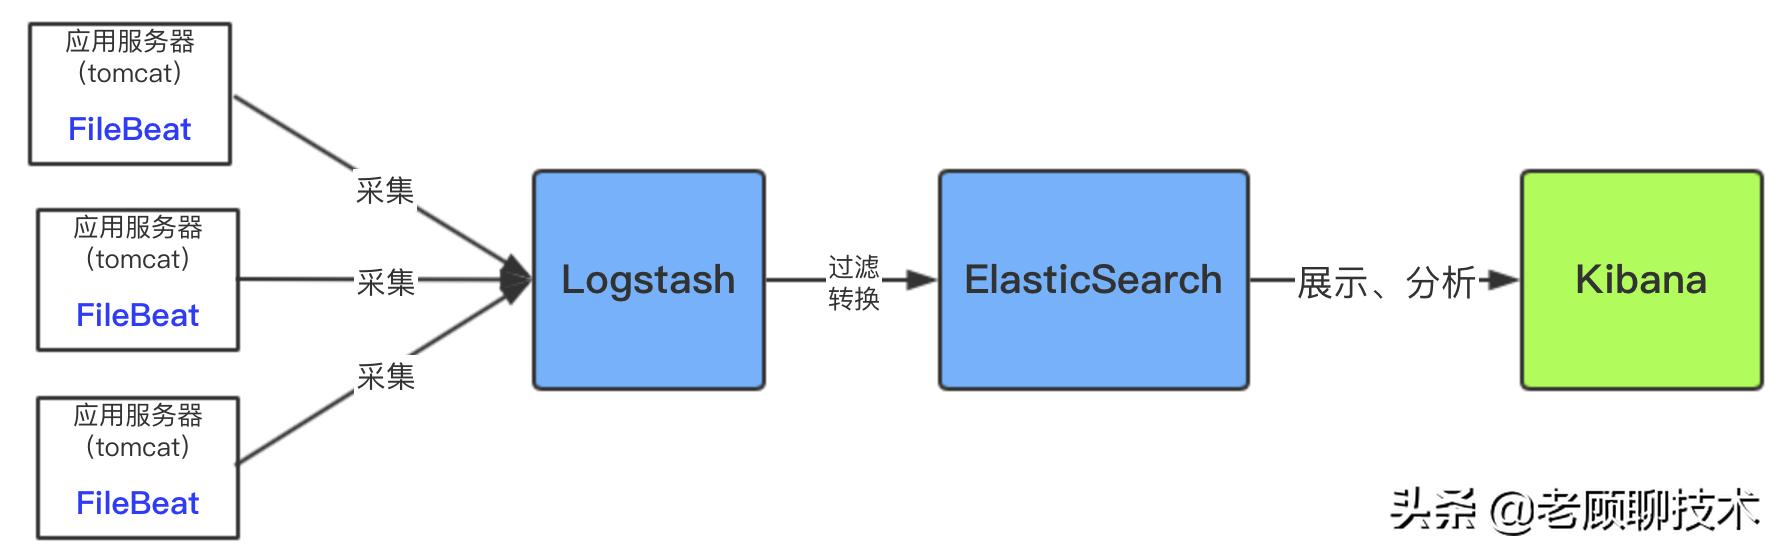
用filebeat采集日志有效降低了收集日志对业务系统的系统资源的消耗。再通过logstash服务器可以过滤,转换日志。这样即满足了日志的过滤转换,也保障了业务系统的性能。
如果日志文件量特别大,以及收集的服务器日志比较多;这样架构中需加入消息中间件做一下缓冲
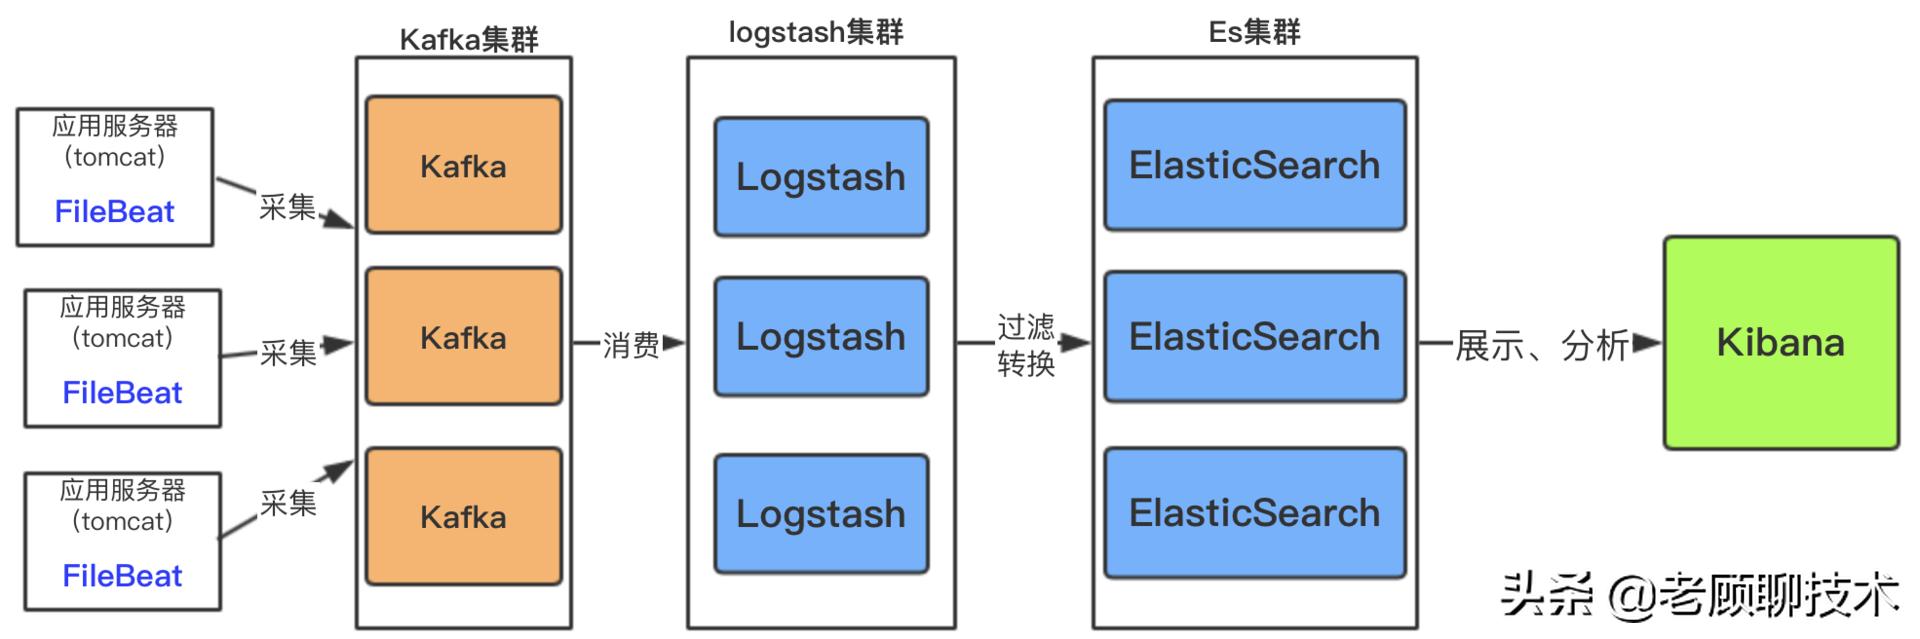
此架构适合大型集群,海量数据的业务场景,消息队列kafka集群架构有效保障了收集数据的安全性和稳定性,而后端logstash和es均采用了集群模式搭建,从整体上提高了ELK的系统的高效性,扩展性和吞吐量。
2,日志收集系统的技术选型
收集日志:FileBeat (Logstash比较大,一般用他来做日志的分析格式化)
存储日志:Elasticsearch(用Hdfs的这种基本是做日志的大数据分析的,比较重)
查看分析:Kibana 用来做日志查看分析,跟Elasticsearch 配合起来使用,可以通过从es里搜索出来的数据做可视化展示,Dashboard数据监控面板
3,服务器
部署es和kibana的服务器
ip 172.16.2.209
login root
passwd root1234....
os CentOS7.7
监听的日志服务器
ip 172.16.2.221
login root
passwd root1234....
os CentOS7.7
日志位置:opt/csctek/log/middleware/tomcat/catalina.log
二,技术掌握阶段
1,FileBeat日志采集器
FileBeat官网:https://www.elastic.co/cn/beats/filebeat
FileBeat收集本地日志到文件:https://www.cnblogs.com/Applogize/p/13545808.html
filebeat启动方式
./filebeat -e -c filebeat.yml -d "publish"
filebeat后台启动方式
./filebeat -e -c filebeat.yml >/dev/null 2>&1 &
filebeat合并多行日志:https://blog.csdn.net/m0_37886429/article/details/102816938
2,安装es和kibana
安装elasticsearch和kibana:https://www.cnblogs.com/fantongxue/p/13471049.html
版本选择:(es / kibana / analysis 版本均选择7.8.1,统一版本)
安装es的过程中可能遇到的问题
elasticsearch启动的时候报错,报日志文件没有权限解决方案:https://blog.csdn.net/leeue/article/details/88530601
max virtual memory areas vm.max_map_count [65530] is too low, increase to at least [262144]:https://blog.csdn.net/xcc_2269861428/article/details/100186654
max file descriptors [4096] for elasticsearch process is too low, increase to at least [65535]:https://blog.csdn.net/qq_38636133/article/details/105621876
安装kibana可能遇到的问题
ErrorEvent { target: WebSocket { _events: [Object: null prototype] :https://blog.csdn.net/haogebing/article/details/110441224
访问es地址:http://172.16.2.209:9200
访问kibana地址:http://172.16.2.209:5601/app/kibana#/home
3,grok_pattern格式(用于过滤日志格式)
filebeat使用elasticsearch的pipeline处理日志内容:http://www.axiaoxin.com/article/236/
grok_pattern格式参考:
https://github.com/elastic/logstash/blob/v1.4.2/patterns/grok-patterns
https://blog.csdn.net/qq_31142553/article/details/115808124
自定义格式参考:
https://blog.csdn.net/wmg_fly/article/details/111590756
https://blog.csdn.net/weixin_34228662/article/details/94048506
创建和测试pipeline,推荐文章:https://elasticstack.blog.csdn.net/article/details/107830887
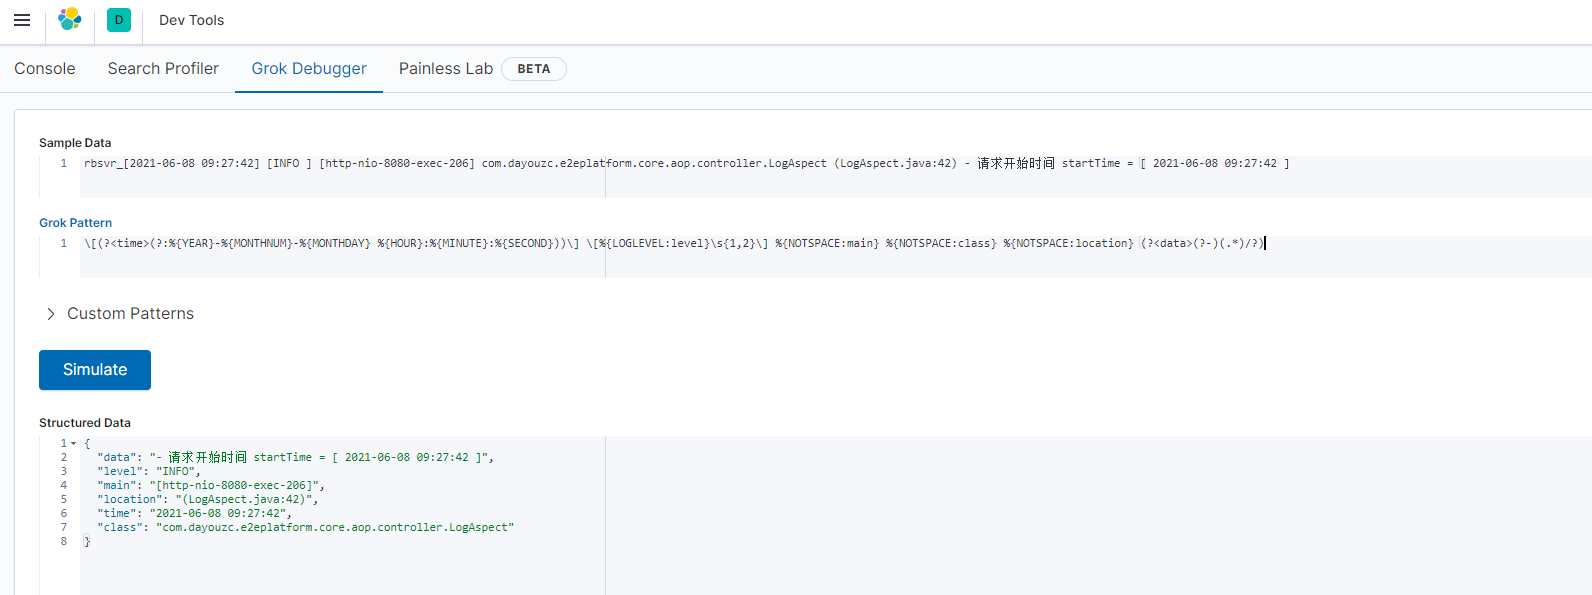
在Kibana中的Grok Debugger中进行调试
Sample Data
rbsvr_[2021-06-08 09:27:45] [INFO ] [http-nio-8080-exec-349] com.dayouzc.e2eplatform.core.aop.controller.LogAspect (LogAspect.java:75) - 请求URL = [ /rbsvr/platforms/mine ]
Grok Pattern
\[(?<time>(?:%{YEAR}-%{MONTHNUM}-%{MONTHDAY} %{HOUR}:%{MINUTE}:%{SECOND}))\] \[%{LOGLEVEL:level}\s{1,2}\] %{NOTSPACE:main} %{NOTSPACE:class} %{NOTSPACE:location} (?<data>(?-)(.*)/?)
给es创建pipeline
在kibana的devtools中发送命令,来创建(上面的\[和\]需要再加一个\用来转义成json格式)
PUT _ingest/pipeline/log_grok_pipeline
{
  "description": "log filter",
  "processors": [
    {
      "grok": {
        "field": "message",
        "patterns": [
          "\\[(?<time>(?:%{YEAR}-%{MONTHNUM}-%{MONTHDAY} %{HOUR}:%{MINUTE}:%{SECOND}))\\] \\[%{LOGLEVEL:level}\\s{1,2}\\] %{NOTSPACE:main} %{NOTSPACE:class} %{NOTSPACE:location} (?<data>(?-)(.*)/?)"
        ]
      }
    }
  ]
}
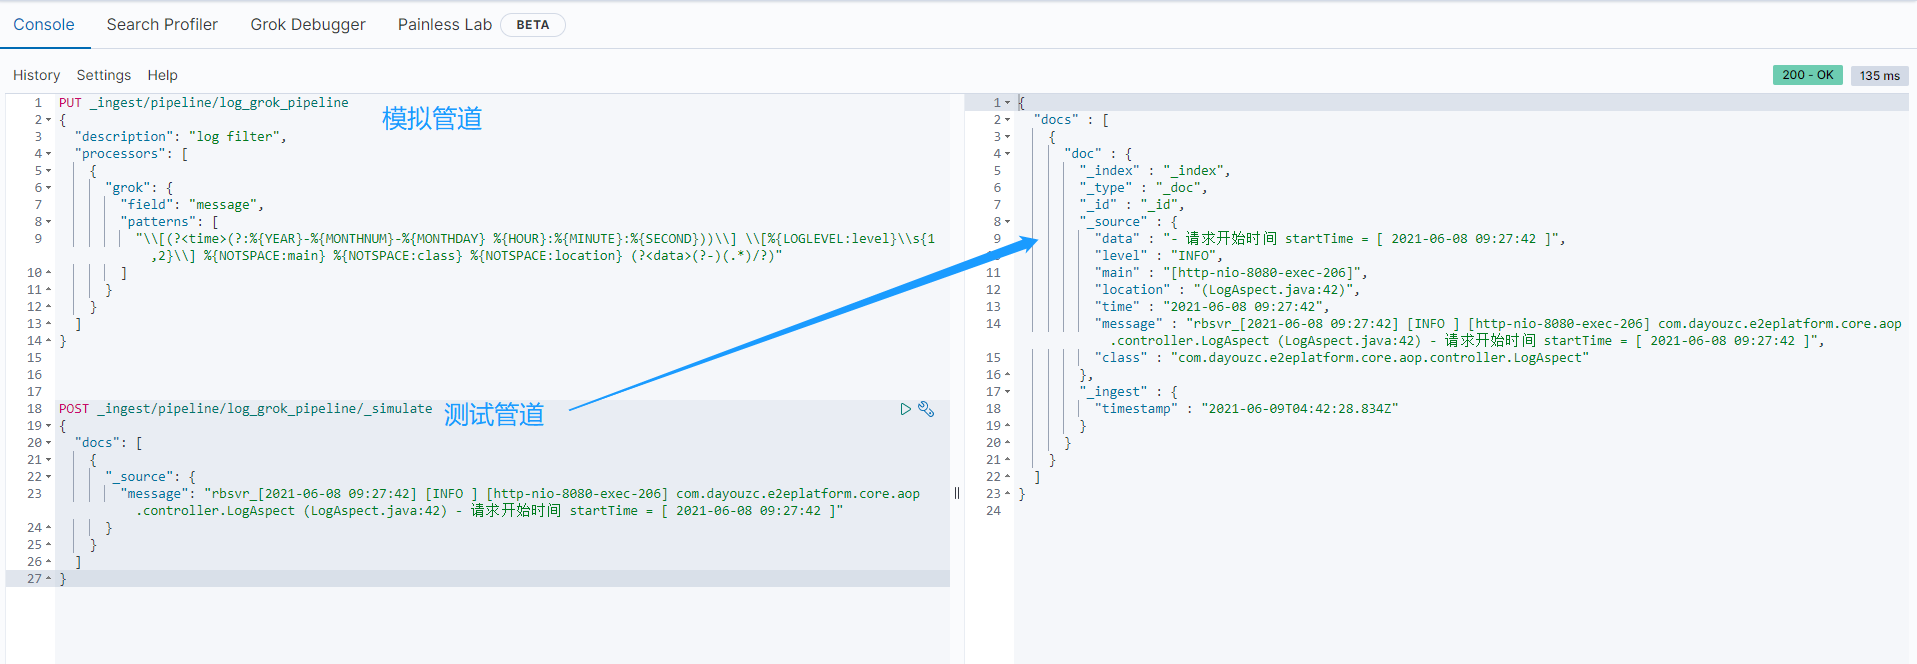
创建好之后在filebeat.yml中配置es信息,重启filebeat
output.elasticsearch:
  hosts: ["172.16.2.209:9200"]
  pipeline: "log_grok_pipeline"
4,写一个脚本用于快速执行
#! /usr/bin/bash
# author:fanjiangfeng
# 启动es和kibana
trap "" HUP INT QUIT TSTP
clear
source /etc/profile
port=9200  #es的端口
port2=5601  #kibana的端口
start_kibana(){
	nohup /usr/local/efk_log/kibana/kibana-7.8.1-linux-x86_64/bin/kibana > /dev/null 2>&1 &
}

while [ 1 ]
do
	echo  "
	 +--------------------------------------+
	 |    1,启动elasticsearch服务            |
	 |    2,关闭elasticsearch服务            |
	 |    3,启动kibana服务                   |
	 |    4,关闭kibana服务                   |
 	 |    5,退出                            |
	 +--------------------------------------+
	     "
	echo -e "\e[1;32m请选择操作:\e[0m"
	read -p "" num
	case "$num" in
	1)
		clear
		if [ $USER == "root" ];then
       		 	echo "请使用普通用户执行脚本,建议切换用户ftx!"
        		exit
		fi
		pid=$(netstat -nlp | grep :$port | awk '{print $7}' | awk -F"/" '{ print $1 }') &>/dev/null
		if [ -n "$pid" ];then
			echo "elasticsearch服务正在运行中,无需再次启动"
		else
			/usr/local/efk_log/es/elasticsearch-7.8.1/bin/elasticsearch -d &>/dev/null
			echo "正在启动elasticsearch,请稍后。。。"
			if [ $? -eq 0 ];then
				echo "elasticsearch启动成功,访问http://172.16.2.209:9200"
			else
				echo "elasticsearch启动失败,前往日志查看原因"
			fi
		fi
		;;
	2)
		clear
		#根据端口号查询对应的pid
		pid=$(netstat -nlp | grep :$port | awk '{print $7}' | awk -F"/" '{ print $1 }') &>/dev/null
		#杀掉对应的进程,如果pid不存在,则不执行
		if [  -n  "$pid"  ];  then
   			kill  -9  $pid;
			echo "elasticsearch服务已停止!"
		else
			echo "elasticsearch服务未运行!"
		fi
		;;
	3)
		clear
		if [ $USER == "root" ];then
			echo "请使用普通用户执行脚本,建议切换用户ftx!"
            exit
        fi
        pid=$(netstat -nlp | grep :$port | awk '{print $7}' | awk -F"/" '{ print $1 }') &>/dev/null
        if [ ! -n "$pid" ];then
            echo "请先启动elasticsearch服务!"
			exit
        fi
        pid2=$(netstat -nlp | grep :$port2 | awk '{print $7}' | awk -F"/" '{ print $1 }') &>/dev/null
        if [ -n "$pid2" ];then
            echo "kibana服务正在运行中,无需再次启动"
		else
			#nohup /usr/local/efk_log/kibana/kibana-7.8.1-linux-x86_64/bin/kibana > /dev/null 2>&1 &
			start_kibana
			if [ $? -eq 0 ];then
				echo "kibana启动成功,访问http://172.16.2.209:5601/app/kibana#/home"
			else
				echo "kibana启动失败,前往日志查看原因"
			fi
        fi
		;;
	4)
		clear
		pid=$(netstat -nlp | grep :$port2 | awk '{print $7}' | awk -F"/" '{ print $1 }') &>/dev/null
		if [  -n  "$pid"  ];  then
            kill  -9  $pid;
            echo "kibana服务已停止!"
        else
            echo "kibana服务未运行!"
        fi
		;;
	5)
		exit
		;;
	*)
		clear
		echo "error";
		;;
	esac
done
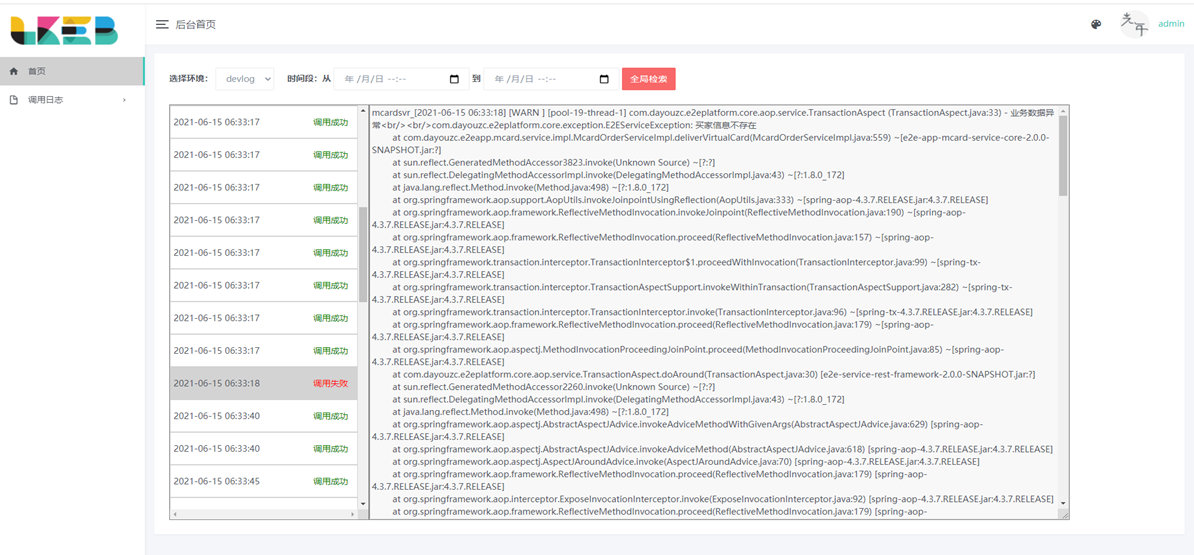
但是由于需求原因,可视化采用自己研发的系统,因此不需要kibana组件了。
5,编码阶段,写日志系统进行展示
工程见github:https://github.com/fantongxue666/EFK_LogCenter
根据@timestamp字段进行范围查询时需要注意的项:
    若使用logstash来做日志收集,logstash会根据事件传输的当前时间自动给事件加上@timestamp字段。

    时间戳的数据类型是date,Date类型在Elasticsearch中有三种方式:
传入格式化的字符串,默认是ISO 8601标准
使用毫秒的时间戳,长整型,直接将毫秒值传入即可
使用秒的时间戳,整型
在Elasticsearch内部,对时间类型字段,是统一采用 UTC 时间。在做查询和显示是需要转换时间内容增加8个小时,调整时区为东八区。
https://segmentfault.com/a/1190000019911946?utm_source=tag-newest
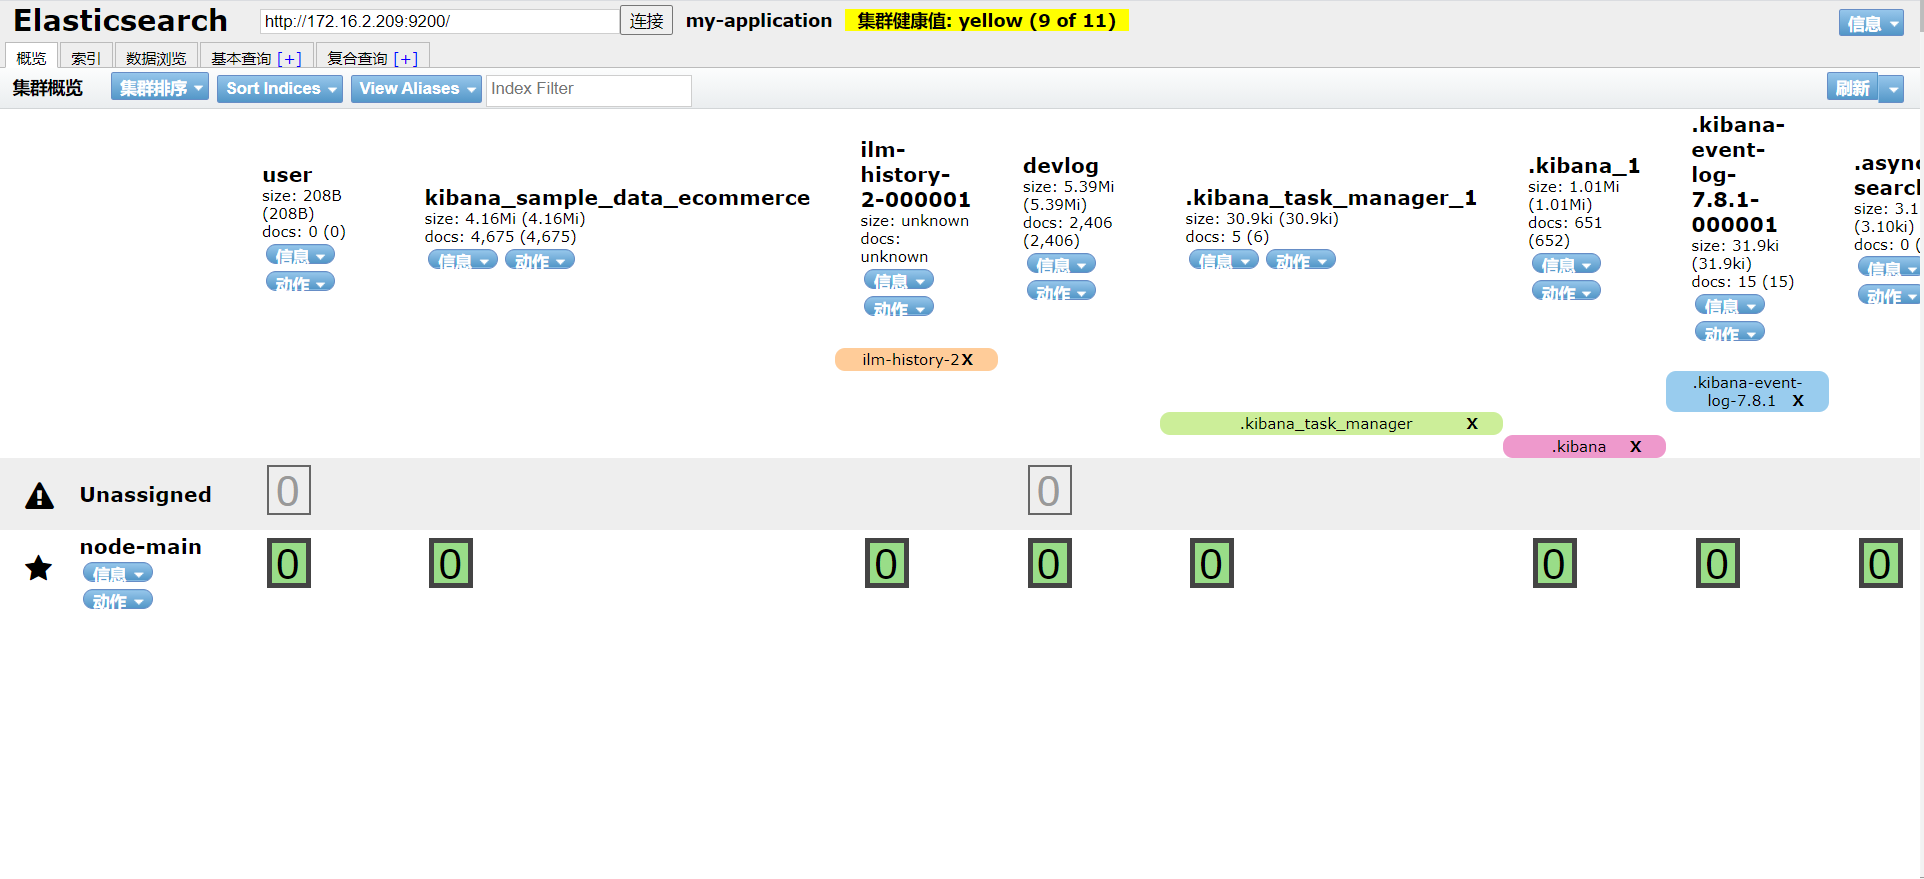
6,windows下安装es的head插件
windows下安装ElasticSearch的Head插件
es 6.2.4 整合插件ElasticSearch-head,并解决跨域问题
访问http://localhost:9100进入页面
7,es和javaAPI的使用
加入依赖
		<dependency>
            <groupId>org.elasticsearch</groupId>
            <artifactId>elasticsearch</artifactId>
            <version>7.8.0</version>
        </dependency>
        <!--elasticsearch的客户端-->
        <dependency>
            <groupId>org.elasticsearch.client</groupId>
            <artifactId>elasticsearch-rest-high-level-client</artifactId>
            <version>7.8.0</version>
        </dependency>
使用api的操作示例
 public static void main(String[] args) throws IOException {
        //############################### 创建es客户端 #############################################
        RestHighLevelClient esClient=new RestHighLevelClient(
                RestClient.builder(new HttpHost("172.16.2.209",9200,"http"))
        );

        //############################### 创建索引(名为user) ########################################
        CreateIndexRequest request=new CreateIndexRequest("user");
        CreateIndexResponse response = esClient.indices().create(request, RequestOptions.DEFAULT);
        //响应结果
        boolean result = response.isAcknowledged();//true或false

        //################################# 查询索引 ###########################################
        GetIndexRequest request1=new GetIndexRequest("user");//查询指定索引的信息
        GetIndexResponse getIndexResponse = esClient.indices().get(request1, RequestOptions.DEFAULT);
        //响应状态
        System.out.println(getIndexResponse.getAliases());
        System.out.println(getIndexResponse.getMappings());
        System.out.println(getIndexResponse.getSettings());

        //################################# 删除索引 ###########################################
        DeleteIndexRequest deleteIndexRequest=new DeleteIndexRequest("user");
        AcknowledgedResponse delete = esClient.indices().delete(deleteIndexRequest, RequestOptions.DEFAULT);
        //响应状态
        boolean acknowledged = delete.isAcknowledged();//true或false

        //################################# 创建文档(新增数据) ###########################################
        IndexRequest indexRequest=new IndexRequest();
        indexRequest.index("user").id("1001");
        User user=new User("test1","test2","test3");
        //像es插入数据,必须将数据转换成json格式
        ObjectMapper mapper=new ObjectMapper();
        String userJson = mapper.writeValueAsString(user);
        indexRequest.source(userJson, XContentType.JSON);
        IndexResponse index = esClient.index(indexRequest, RequestOptions.DEFAULT);
        System.out.println(index.getResult());

        //################################# 更新文档(修改数据) ###########################################
        UpdateRequest updateRequest=new UpdateRequest();
        updateRequest.index("user").id("1001");
        updateRequest.doc(XContentType.JSON,"sex","女");
        UpdateResponse update = esClient.update(updateRequest, RequestOptions.DEFAULT);
        System.out.println(update.getResult());

        //################################# 查询文档(根据文档id查询数据) ###########################################
        GetRequest getRequest=new GetRequest();
        getRequest.index("user").id("1001");
        GetResponse documentFields = esClient.get(getRequest, RequestOptions.DEFAULT);
        System.out.println(documentFields.getSourceAsString());
        System.out.println(documentFields.getField("message"));

        //################################# 删除文档(根据文档id删除数据) ###########################################
        DeleteRequest deleteRequest=new DeleteRequest();
        deleteRequest.index("user").id("1001");
        DeleteResponse delete1 = esClient.delete(deleteRequest, RequestOptions.DEFAULT);
        System.out.println(delete1.getResult());

        //################################# 批量创建文档 ###########################################
        BulkRequest bulkRequest=new BulkRequest();
        bulkRequest.add(new IndexRequest().index("user").id("1001").source(XContentType.JSON,"name","zhangsan"));
        bulkRequest.add(new IndexRequest().index("user").id("1002").source(XContentType.JSON,"name","lisi"));
        bulkRequest.add(new IndexRequest().index("user").id("1003").source(XContentType.JSON,"name","wangwu"));
        BulkResponse bulk = esClient.bulk(bulkRequest, RequestOptions.DEFAULT);
        System.out.println(bulk.getTook());
        System.out.println(bulk.getItems());

        //################################# 批量删除文档 ###########################################
        BulkRequest deleteRequests=new BulkRequest();
        deleteRequests.add(new DeleteRequest().index("user").id("1001"));
        deleteRequests.add(new DeleteRequest().index("user").id("1002"));
        deleteRequests.add(new DeleteRequest().index("user").id("1003"));
        BulkResponse bulk1 = esClient.bulk(bulkRequest, RequestOptions.DEFAULT);
        System.out.println(bulk1.getTook());
        System.out.println(bulk1.getItems());

        //################################# 查询索引中全部的数据 ###########################################
        SearchRequest searchRequest=new SearchRequest();
        searchRequest.indices("user");//索引名
        SearchSourceBuilder builder = new SearchSourceBuilder().query(QueryBuilders.matchAllQuery());
        /**
         * 查询分页
         */
        builder.from(0);
        builder.size(10);
        /**
         * 排序
         */
        builder.sort("age", SortOrder.DESC);
        /**
         * 过滤字段
         */
        String[] excludes={};
        String[] includes={"name"};
        builder.fetchSource(includes,excludes);

        searchRequest.source(builder);
        SearchResponse response1 = esClient.search(searchRequest, RequestOptions.DEFAULT);
        SearchHits hits = response1.getHits();
        System.out.println(hits.getTotalHits());//总条数
        System.out.println(response1.getTook());//查询时间
        for(SearchHit hit:hits){
            System.out.println(hit.getSourceAsString());
        }

        //################################# 条件查询 ###########################################
        //条件查询(精确条件)
        searchRequest.source(new SearchSourceBuilder().query(QueryBuilders.termQuery("age","30")));


        //#################################### 多条件查询 #######################################
        /**
         * ........
         * SearchSourceBuilder builders = new SearchSourceBuilder().query(QueryBuilders.matchAllQuery());
         *         BoolQueryBuilder boolQueryBuilder = QueryBuilders.boolQuery();
         *         boolQueryBuilder.must(QueryBuilders.matchQuery("age",30));
         *         boolQueryBuilder.mustNot(QueryBuilders.matchQuery("age",40));
         *         boolQueryBuilder.should(QueryBuilders.matchQuery("sex","男"));
         *         builder.query(boolQueryBuilder);
         *
         * ........
         */
        //#################################### 范围查询 #######################################
        /**
         * .......
         * SearchSourceBuilder builders = new SearchSourceBuilder();
         *         RangeQueryBuilder rangeQuery = QueryBuilders.rangeQuery("age");
         *         rangeQuery.gte(30);//大于等于
         *         rangeQuery.lte(50);//小于等于
         *         builders.query(rangeQuery);
         * .......
         */

        //#################################### 模糊查询 #######################################
        /**
         *  SearchSourceBuilder builders = new SearchSourceBuilder();
         *         builders.query(QueryBuilders.fuzzyQuery("name","wangwu").fuzziness(Fuzziness.ONE));
         *
         */

        //#################################### 查询结果高亮显示 #######################################
        SearchSourceBuilder builders = new SearchSourceBuilder();
        TermsQueryBuilder termsQueryBuilder = QueryBuilders.termsQuery("name", "wangwu");
        HighlightBuilder highlightBuilder = new HighlightBuilder();
        highlightBuilder.preTags("<font color='red'>");
        highlightBuilder.postTags("</font>");
        highlightBuilder.field("name");
        builders.highlighter(highlightBuilder);
        builders.query(termsQueryBuilder);

        //#################################### 关闭es客户端 #######################################
        esClient.close();
    }
更多内容看github源码。
三,FileBeat / ElasticSearch的配置文件
1,es的配置文件
# ======================== Elasticsearch Configuration =========================
#
# NOTE: Elasticsearch comes with reasonable defaults for most settings.
#       Before you set out to tweak and tune the configuration, make sure you
#       understand what are you trying to accomplish and the consequences.
#
# The primary way of configuring a node is via this file. This template lists
# the most important settings you may want to configure for a production cluster.
#
# Please consult the documentation for further information on configuration options:
# https://www.elastic.co/guide/en/elasticsearch/reference/index.html
#
# ---------------------------------- Cluster -----------------------------------
#
# Use a descriptive name for your cluster:
#配置es的集群名称,es会自动发现在同一网段下的es,如果在同一网段下有多个集群,就可以用这个属性来区分不同的集群。
cluster.name: my-application
#
# ------------------------------------ Node ------------------------------------
#
# Use a descriptive name for the node:
#节点名
node.name: node-main
#
# Add custom attributes to the node:
#
#node.attr.rack: r1
#
# ----------------------------------- Paths ------------------------------------
#
# Path to directory where to store the data (separate multiple locations by comma):
#
path.data: /usr/local/efk_log/es/data
#
# Path to log files:
#
path.logs: /usr/local/efk_log/es/logs
#
# ----------------------------------- Memory -----------------------------------
#
# Lock the memory on startup:
#
#bootstrap.memory_lock: true
#
# Make sure that the heap size is set to about half the memory available
# on the system and that the owner of the process is allowed to use this
# limit.
#
# Elasticsearch performs poorly when the system is swapping the memory.
#
# ---------------------------------- Network -----------------------------------
#
# Set the bind address to a specific IP (IPv4 or IPv6):
#
network.host: 0.0.0.0
#
# Set a custom port for HTTP:
#
http.port: 9200
http.cors.enabled: true
http.cors.allow-origin: "*"
#
# For more information, consult the network module documentation.
#
# --------------------------------- Discovery ----------------------------------
#
# Pass an initial list of hosts to perform discovery when this node is started:
# The default list of hosts is ["127.0.0.1", "[::1]"]
#
#discovery.seed_hosts: ["host1", "host2"]
#
# Bootstrap the cluster using an initial set of master-eligible nodes:
#集群的节点列表
cluster.initial_master_nodes: ["node-main"]
#
# For more information, consult the discovery and cluster formation module documentation.
#
# ---------------------------------- Gateway -----------------------------------
#
# Block initial recovery after a full cluster restart until N nodes are started:
#
#gateway.recover_after_nodes: 3
#
# For more information, consult the gateway module documentation.
#
# ---------------------------------- Various -----------------------------------
#
# Require explicit names when deleting indices:
#
#action.destructive_requires_name: true
2,filebeat的配置文件
###################### Filebeat Configuration Example #########################

# This file is an example configuration file highlighting only the most common
# options. The filebeat.reference.yml file from the same directory contains all the
# supported options with more comments. You can use it as a reference.
#
# You can find the full configuration reference here:
# https://www.elastic.co/guide/en/beats/filebeat/index.html

# For more available modules and options, please see the filebeat.reference.yml sample
# configuration file.

#=========================== Filebeat inputs =============================

filebeat.inputs:

# Each - is an input. Most options can be set at the input level, so
# you can use different inputs for various configurations.
# Below are the input specific configurations.

- type: log

  # Change to true to enable this input configuration.
  enabled: true

  # Paths that should be crawled and fetched. Glob based paths.
  paths:
    - /opt/csctek/log/middleware/tomcat/*.out
    #- c:\programdata\elasticsearch\logs\*
  input_type: log
  # Exclude lines. A list of regular expressions to match. It drops the lines that are
  # matching any regular expression from the list.
  #exclude_lines: ['^DBG']

  # Include lines. A list of regular expressions to match. It exports the lines that are
  # matching any regular expression from the list.
  #include_lines: ['^ERR', '^WARN']

  # Exclude files. A list of regular expressions to match. Filebeat drops the files that
  # are matching any regular expression from the list. By default, no files are dropped.
  #exclude_files: ['.gz$']

  # Optional additional fields. These fields can be freely picked
  # to add additional information to the crawled log files for filtering
  #fields:
  #  level: debug
  #  review: 1

  ### Multiline options

  # Multiline can be used for log messages spanning multiple lines. This is common
  # for Java Stack Traces or C-Line Continuation

  # The regexp Pattern that has to be matched. The example pattern matches all lines starting with [
  multiline.pattern: '=================== REST Token Interceptor start ======================='
  multiline.negate: true
  multiline.match: after
  multiline.flush_pattern: '=================== REST Token Interceptor e n d ======================='


#============================= Filebeat modules ===============================

filebeat.config.modules:
  # Glob pattern for configuration loading
  path: ${path.config}/modules.d/*.yml

  # Set to true to enable config reloading
  reload.enabled: true

  # Period on which files under path should be checked for changes
  #reload.period: 10s

#==================== Elasticsearch template setting ==========================

setup.template.settings:
  index.number_of_shards: 3
  #index.codec: best_compression
  #_source.enabled: false

#================================ General =====================================

# The name of the shipper that publishes the network data. It can be used to group
# all the transactions sent by a single shipper in the web interface.
#name:

# The tags of the shipper are included in their own field with each
# transaction published.
#tags: ["service-X", "web-tier"]

# Optional fields that you can specify to add additional information to the
# output.
#fields:
#  env: staging


#============================== Dashboards =====================================
# These settings control loading the sample dashboards to the Kibana index. Loading
# the dashboards is disabled by default and can be enabled either by setting the
# options here, or by using the `-setup` CLI flag or the `setup` command.
#setup.dashboards.enabled: false

# The URL from where to download the dashboards archive. By default this URL
# has a value which is computed based on the Beat name and version. For released
# versions, this URL points to the dashboard archive on the artifacts.elastic.co
# website.
#setup.dashboards.url:

#============================== Kibana =====================================

# Starting with Beats version 6.0.0, the dashboards are loaded via the Kibana API.
# This requires a Kibana endpoint configuration.
setup.kibana:

  # Kibana Host
  # Scheme and port can be left out and will be set to the default (http and 5601)
  # In case you specify and additional path, the scheme is required: http://localhost:5601/path
  # IPv6 addresses should always be defined as: https://[2001:db8::1]:5601
  host: "172.16.2.209:5601"

  # Kibana Space ID
  # ID of the Kibana Space into which the dashboards should be loaded. By default,
  # the Default Space will be used.
  #space.id:

#============================= Elastic Cloud ==================================

# These settings simplify using filebeat with the Elastic Cloud (https://cloud.elastic.co/).

# The cloud.id setting overwrites the `output.elasticsearch.hosts` and
# `setup.kibana.host` options.
# You can find the `cloud.id` in the Elastic Cloud web UI.
#cloud.id:

# The cloud.auth setting overwrites the `output.elasticsearch.username` and
# `output.elasticsearch.password` settings. The format is `<user>:<pass>`.
#cloud.auth:

#================================ Outputs =====================================

# Configure what output to use when sending the data collected by the beat.

#-------------------------- Elasticsearch output ------------------------------

setup.template.enabled: false
setup.template.name: "devlog"
setup.template.pattern: "devlog-*"
output.elasticsearch:
  # Array of hosts to connect to.
  hosts: ["172.16.2.209:9200"]
  # es的pipline管道名称,为了解析每一行的日志的格式,使用了正则表达式来匹配日志行,达到每一块用一个字段来存储和表示
  pipeline: "log_grok_pipeline"
  # Enabled ilm (beta) to use index lifecycle management instead daily indices.
  #ilm.enabled: false
  index: "devlog"
  #template.name: "devlog"
  #template.path: "devlog.template.json"
  #template.overwrite: false
  # Optional protocol and basic auth credentials.
  #protocol: "https"
  #username: "elastic"
  #password: "changeme"

#----------------------------- Logstash output --------------------------------
#output.logstash:
  # The Logstash hosts
  #hosts: ["localhost:5044"]

  # Optional SSL. By default is off.
  # List of root certificates for HTTPS server verifications
  #ssl.certificate_authorities: ["/etc/pki/root/ca.pem"]

  # Certificate for SSL client authentication
  #ssl.certificate: "/etc/pki/client/cert.pem"

  # Client Certificate Key
  #ssl.key: "/etc/pki/client/cert.key"

#================================ Processors =====================================

# Configure processors to enhance or manipulate events generated by the beat.

processors:
  - add_host_metadata: ~
  - add_cloud_metadata: ~
  - drop_fields:
      fields:
      - offset
      - host

#================================ Logging =====================================

# Sets log level. The default log level is info.
# Available log levels are: error, warning, info, debug
#logging.level: debug

# At debug level, you can selectively enable logging only for some components.
# To enable all selectors use ["*"]. Examples of other selectors are "beat",
# "publish", "service".
#logging.selectors: ["*"]

#============================== Xpack Monitoring ===============================
# filebeat can export internal metrics to a central Elasticsearch monitoring
# cluster.  This requires xpack monitoring to be enabled in Elasticsearch.  The
# reporting is disabled by default.

# Set to true to enable the monitoring reporter.
#xpack.monitoring.enabled: false

# Uncomment to send the metrics to Elasticsearch. Most settings from the
# Elasticsearch output are accepted here as well. Any setting that is not set is
# automatically inherited from the Elasticsearch output configuration, so if you
# have the Elasticsearch output configured, you can simply uncomment the
# following line.
#xpack.monitoring.elasticsearch:
四,关于es的知识进阶阶段
1,解析es的分布架构
分片机制(shard):我们不用关心数据是按照什么机制分片的,最后放入哪个分片中
分片的副本(replica):任何一个服务器随时可能故障或宕机,此时shard可能就会丢失,因此可以为每个shard创建多个replica副本。replica可以在shard故障时提供备用服务,保证数据不丢失,多个replica还可以提升搜索操作的吞吐量和性能。primary shard(建立索引时一次设置,不能修改,默认5个),replica shard(随时修改数量,默认1个),默认每个索引10个shard,5个primary shard,5个replica shard,最小的高可用配置,是2台服务器
集群发现机制(cluster discovery):当前启动了一个es进程,当启动了第二个es进程时,这个进程作为一个node自动就发现了集群,并加入进去
shard负载均衡:比如现在有10shard,集群中有3个节点,es会均衡的进行分配,以保持每个节点均衡的负载请求
请求路由:!!es路由原理 在es中,一个index会被分片,一个index中存在很多document,这个document存放在不同的shard ,而一个document只能存在于一个primary shard中,这样,当客户端创建一个document并存入es时,es内部就需要决定这个document存于那一个primary shard,这就是es中的document 路由分发
2,扩容机制
垂直扩容:购置新的机器,替换已有的机器
水平扩容:直接增加机器
rebalance:增加或减少节点时会自动均衡
master节点:主节点的主要职责是和集群操作相关的内容,如创建或删除索引,跟踪哪些节点是集群的一部分,并决定哪些分片分配给相关的节点。稳定的主节点对集群的健康是非常重要的。
节点对等:每个节点都能接受请求,每个节点接受请求后都能把该请求的路由到有关数据的其他节点上,接收原始请求的节点负责采集数据并返回给客户端
3,分片和副本机制
index包含有多个shard
每个shard都是一个最小工作单元,承载部门数据;每个shard都是一个lucene实例,有完整的建立索引和处理请求的能力
增减节点时,shard会自动在nodes中负载均衡
primary shard和replica shard,每个document肯定只存在某一个primary shard以及其对应的replica shard中,不可能存在多个primary shard
replica shard是primary shard的副本,负责容错,以及承担读请求负载
primary shard的数量在创建索引的时候就固定了,replica shard的数量可以随时修改(因为在保存文档的时候是根据路由Id进行hash算法确定这个文档保存在哪个主分片下,若主分片数量修改,那么同样的路由Id进行读取此文档,经过hash算法之后确定了此文档所在分片的位置,但此时分片的位置显然不是原档存入的位置,所以会造成数据缺失,查找不到数据)
(创建索引时若不指定)primary shard的默认数量是5,replica是1,即默认有10个shard,5个primary shard,5个replica shard
primary shard不能和自己的replica shard放在一个同一个节点上(否则节点宕机,primary shard和副本都丢失,起不到容错的作用),但是可以和其他primary shard的replica shard放在同一个节点上
4,文档数据路由原理分析
数据路由:一个索引有多个分片组成,当添加(查看、修改、删除)一个文档时,es就需要决定这个文档存储在哪个分片上,这个过程就叫做数据路由(routing)
路由算法:
shard = hash(routing) % number_of_primary_shards
示例:一个索引,三个primary shard
① 每次增删改查时都有一个routing值,默认是文档的_id的值
② 对这个routing值使用哈希函数进行计算
③ 计算出的值再和主分片个数取余数
余数肯定在0----(number_of_primary_shards-1)之间,文档就在对应的shard上
routing默认值是文档的_id的值,也可以手动指定一个值,手动指定对于负载均衡以及提高批量读取的性能都有帮助
primary shard个数一旦确定就不能修改了
在集群中,节点的状态有三种
绿色:健康状态,所有主分片和副本分片都可以正常工作
黄色:警告状态,所有主分片目前都可以直接运行,但是至少有一个副本分片是不能正常工作的
红色:表示集群无法正常工作
5,索引管理
5.1 修改索引的副本数
PUT 索引名/_settings
{
    "number_of_replicas":2
}
5.2 修改索引的读写权限
索引创建成功后,可以向索引中写入文档
PUT 索引名/_doc/1
{
    "title":"三国演义"
}
默认情况下,索引是具备读写权限的,当然这个读写权限可以关闭
例如,关闭索引的写权限
PUT 索引名/_settings
{
    "blocks.write":true
}
关闭之后,就无法添加文档了,可以再次打开,改为false
其他类似的权限有
- blocks.write
- blocks.read
- blocks.read_only
5.3 索引打开/关闭
关闭索引
POST 索引名/_close
打开索引
POST 索引名/_open
当然,可以同时关闭/打开多个索引,多个索引用逗号隔开,或者直接使用_all代表所有索引。
5.4 复制索引
索引复制,只会复制数据,不会复制索引配置
POST _reindex
{
    "source":{"index":"索引名"},
    "dest":{"index":"新索引名"}
}
6,elasticsearch文档路由
上面已经分析了文档路由机制,默认的这种路由模式,最大的优势在于负载均衡,这种方式可以保证平均分配在不同的分片上,但是他有一个很大的劣势,就是查询时候无法确定文档的位置,此时它会请求广播到所有的分片上去执行,另一方面,使用默认的路由模式,后期修改分片数量不方便。
当然开发者也可以自定义routing的值,方式如下
PUT 索引名/_doc/d?routing=javaboy
{
"title":"d"
}
如果文档在添加时指定了routing,则查询,删除更新时也需要指定routing。
GET 索引名/_doc/d?routing=javaboy
自定义routing有可能会导致负载不均衡,这个还是要结合实际情况选择。
典型场景:
对于用户数据,我们可以将userid作为routing,这样就能保证同一个用户的数据保存在同一个分片中,检索时,同样使用userid作为routing,这样就可以精准的从某一个分片中获取数据。
五,最终效果图(初始版本)
第一个版本如下,后期如果有新内容补充,则会更新此博客。
-------------------------------------------
个性签名:独学而无友,则孤陋而寡闻。做一个灵魂有趣的人!
如果觉得这篇文章对你有小小的帮助的话,记得在右下角点个“推荐”哦,博主在此感谢!
万水千山总是情,打赏一分行不行,所以如果你心情还比较高兴,也是可以扫码打赏博主,哈哈哈(っ•̀ω•́)っ✎⁾⁾!

 浙公网安备 33010602011771号