Time-Series Analysis
Time-Series Analysis
A time series is a set of observations for a variable over successive periods of time(e.g., monthly stock market returns for the past ten years). The series has a trend if a consistent pattern can be seen by plotting the data(i.e., the individual observations) on a graph.
Linear Trend Model
A linear trend is a time series pattern that can be graphed using a straight line.
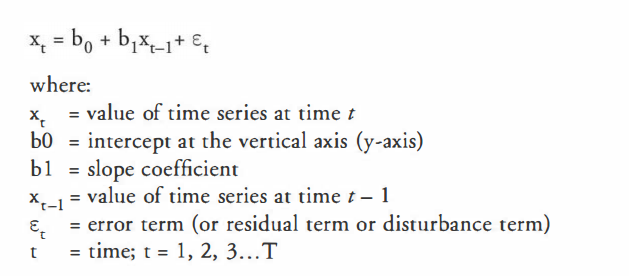
The simplest form of a linear trend is represented by the following linear trend model:
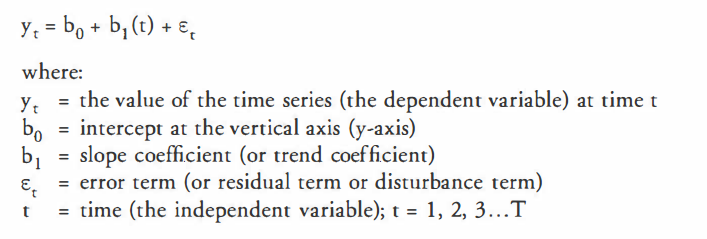
Ordinary least square(OLS, 最小二乘法)regression is used to estimate the coefficient in the trend line, which probides the following prediction equation:

Log-Linear Trend Models
Time series data, particularly financial time series, often display exponential growth (growth with continuous compounding). Positive exponential growth means that the random variable (i.e., the time series) tends to increase at some constant rate of growth. If we plot the data, the observations will form a convex (凸) curve. Negative exponential growth means that the data tends to decrease at some constant rate of decay, and the plotted time series will be a concave (凹) curve.
With a series exhibits exponential growth, it can be modeled as:
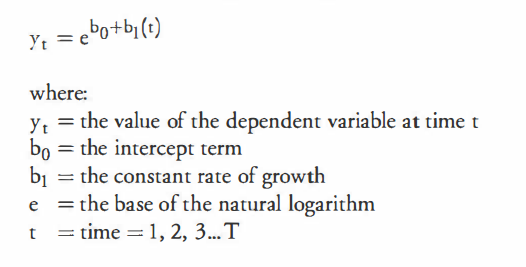
This model defines y, the dependent variable, as an exponential function of time, the independent variable. Rather than try to fit the nonlinear data with linear (straight line) regression, we take the natural log of both sides of the equation and arrive at the log-linear model. This is frequently used when time series data exhibit exponential growth.
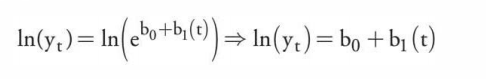
Now that the equation has been transformed from an exponential to linear function, we can use a linear regression technique to model the series.
Factors that Determine Which Model is Best
To determine if a linear or log-linear trend model should be used, the analyst should plot the data. A linear trend model may be appropriate if the data points appear to be equally distributed above and below the gression line. Inflation rate data can often be modeled with a linear trend model.
If, on the other hand, the data plots with a non-linear(curved) shape, then the residuals from a linear trend model will be persistently positive or negative for a period of time. In this case, the log-linear model may be more appropriate. Financial data (e.g., stock indices and stock prices) and company sales data are often best modeled with log-linear models.
The figure below shows a time series that is bested modeled using a log-linear trend model rather than a linear trend model.
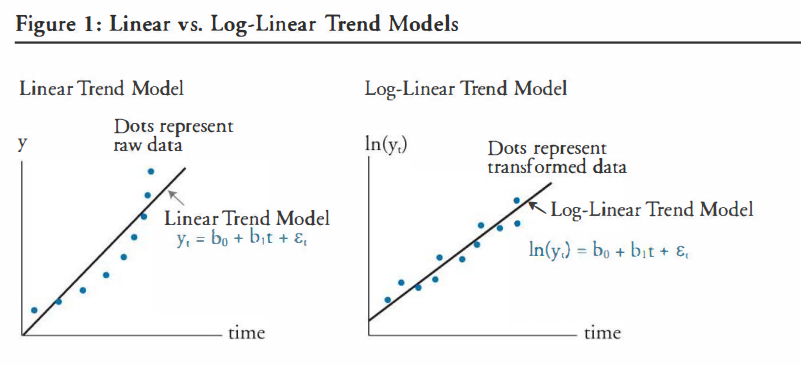
The bottom line is that when a variable grows at a constant rate, a log-linear model is most appropriate. When the variable increases over time by a constant amount, a linear trend model is most appropriate.
Autoregressive Model (AR) and Covariance Stationary
When the dependent variable is regressed against one or more lagged values of itself, the result model is called as an autoregressive model(AR). For example, the sales for a firm could be regressed against the sales for the firm in the previous month.
In an autoregressive time series, past values of a variable are used to predict the current(and hence future) value of the variable.
Statistical inferences based on ordinary least squares(OLS) estimates for an AR time series model may be invalid unless the time series being modeled is covariance stationary.
A time series is covariance stationary if it satisfies the following 3 conditions:
- Constant and finite expected value. The expected value of the time series is constant over time. (mean-reverting level)
- Constant and finite variance. The time series' volatility around its mean (i.e., the distribution of the individual observations around the mean) does not change over time.
- Constant and finite covariance between values at any give lag. The covariance of the time series with leading or lagged values of itself is constant.
The Structure of an Autoregressive(AR) model of order P
The following model illustrates how variable x would be regressed on itself with a lag of one and two periods:
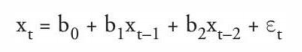
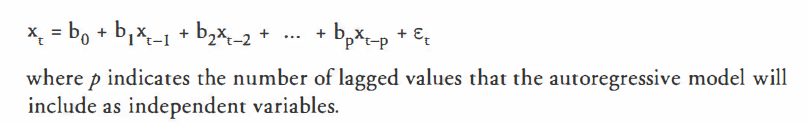
Such a model is referred to as a second-order autoregressive model, or an AR(2) model. In general, an AR model of order p, AR(p), is expressed as:
Forcasting with an Autoregressive Model
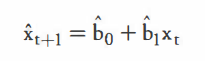
A one-period-ahead forecast for an AR(1) model is determined in the following manner:
Likewise, a two-step-ahead forecast for an AR(1) model is calculated as:
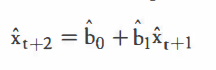
Note that the ^ symbol above the variables in the equations indicates that the inputs used in multi-period forecasts are actually forecasts(estimates) themselves. This implies that multi-period forecasts are more uncertain than single-period forecasts. For example, for a two-step-ahead forecast, there is the usual uncertainty associated with forecasting x(t+1) using x(t), plus the additional uncertainty of forecasting x(t+2) using the forecasted value for x(t+1)
Autocorrelation & Model Fit
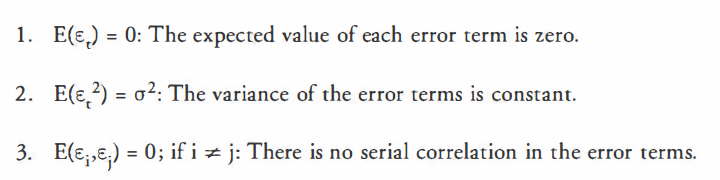
When an AR model is correctly specified, the residual terms will not exhibit serial correlation. Serial correlation (or autocorrelation) means the error terms are positively or negatively correlated. When the error terms are correlated, standard errors are unreliable and t-test of individual coefficients can incorrectly show statistical significance or insignificance.
If the residuals have significant autocorrelation, the AR model that produced the residuals is not the best model for the time series being analyzed. The procedure to test whether an AR time series model is correctly specified involves three steps:
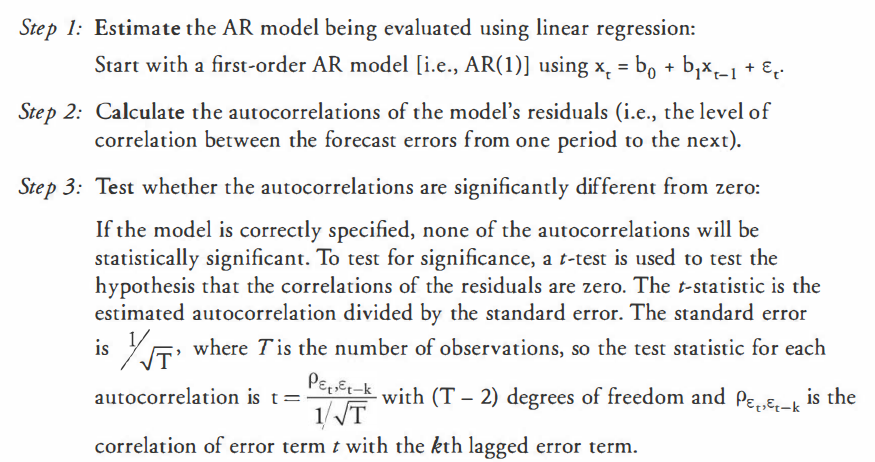
The Durbin-Watson test that we used with trend models is not appropriate for testing for serial correlation of the error terms in autoregressive model. Use this t-test instead.
Mean Reversion, Mean-Reverting Level
A time series exhibits mean reversion if it has a tendency to move toward its mean. In other words, the time series has a tendency to decline when the current value is above the mean and rise when the current value is below the mean. If a time series is at its mean-reverting level, the model predicts that the next value of the time series will be the same as its current value.
For an AR(1) model, x(t) = b0 + b1x(t-1), the above equality implies that x(t) = b0 + b1x(t). Solving for x(t), the mean-reverting level is expressed as x(t)=b0/(1-b1).
So, if x(t) > b0/(1-b1), the AR(1) model predicts that x(t+1) will be lower than x(t), and if x(t) < b0/(1-b1), the model predicts that x(t+1) will be higher than x(t).
All covariance stationary time series have a finite mean-reverting level. An AR(1) time series will have a finite mean-reverting level when the absolute value of the lag coefficient is less than 1. (i.e. |b1|<1)
Random Walk
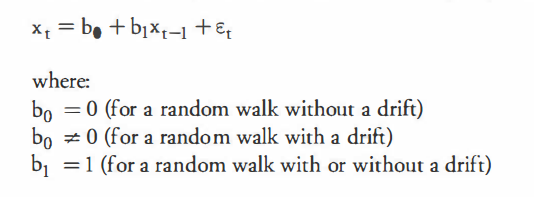
Random walk. If a time series follows a random walk process, the predicated value of the series (i.e., the value of the dependent variable) in one period is equal to the value of the series in the previous period plus a random error term.
A time series that follows a simple random walk process is described in equation form as

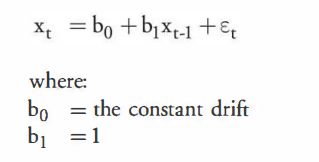
Random Walk with a Drift. If a time series follows a random walk with a drift, the intercept term is not equal to zero. That is, in addition to a random error term, the time series is expected to increase or decrease by a constant amount each period. A random walk with a drift can be described as:
Covariance Stationarity Neither a random walk nor a random walk with a drift exhibits covariance stationarity. To show this, let's start by expressing a random walk as:
In either case(with or without a drift), the mean-reverting level is b0/(1-b1) = b0/0 (the division of any number by zero is undefined), and as we started earlier, a time series must have a finite mean-reverting level to be covariance stationary. Thus, a a walk, with or without a drift, is not covariance stationary, and exhibits what is known as a unit root (b1=1). For a time series that is not covariance stationary, the least squares regression procedure that we have been using to estimate an AR(1) model will not work without transforming the data.
Unit Root Testing for Nonstationarity
To determine whether a time series is covariance stationary, we can (1)run an AR model and examine autocorrelation, or (2) perform the Dickey Fuller test.
In the first method, an AR model is estimated and the statistical significance of the autocorrelations at various lags is examined. A stationary process will usually have residual autocorrelations insignificantly different from zero at all lags or residual autocorrelations that decay to zero as the number of lags increase.
A more definitive test for unit root is the Dickey Fuller test. For statistical reasons, you cannot directly test whether the coefficient on the independent variable in an AR time series is equal to 1.0. To compensate, Dickey and Fuller created a rather ingenious test for a unit root. Remember, if an AR(1) model has a coefficient of 1, it has a unit root and no finite mean reverting level (i.e. it is not covariance stationary). Dickey and Fuller (DF) transform the AR(1) model to run a simple regression. To transform the model, they (1) start with the basic form of the AR(1) model and (2) substract x(t-1) from both sides:
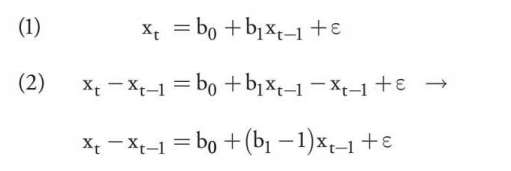
Then, rather than directly testing whether the original coefficient is different from 1, they test whether the new, transformed coefficient (b1-1) is different from zero using a modified t-test. If (b1-1) is not significantly different from zero, they say that b1 must be equal to 1.0, and therefore, the series must have a unit root.
First Differencing
If we believe a time series is a random walk (i.e., has a unit root), we can transform the data to a covariance stationary time series using a procedure called first differencing. The first differencing process involves substracting the value of the time series(i.e. the dependent variable) in the immediately preceding period from the current value of the time series to define a new dependent variable, y. Note that by taking first differences, you model the change in the value of dependent variable rather than the value of the dependent variable.
So, if the original time series of x has a unit root, the change in x, x(t) - x(t-1) is just the error term. This means we can define y(t) as:

Then, stating y in the form of an AR(1) model:
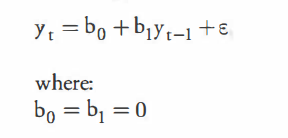
This transformed time series has a finite mean-reverting level of 0/(1-0) = 0 and is, therefore, covariance stationary.
Seasonality
Seasonality in a time-series is a pattern that tends to repeat from one year to year. One example is monthly sales data for a retailer. Given that sales data normally vary according to the time of year, we might expect this month's sales(x(t)) to be related to sales for the same month last year (x(t-12)).
When seasonality is present, modeling the associated time series data would be misspecified unless the AR model incorporates the effects of the seasonality.
With an AR(1) model, we lose one observation, with an AR(2) model, we lose two observations, and so on.
Correcting for seasonality. To adjust for seasonality in an AR model, an additional lag of the dependent variable is added to the original model as another independent variable.For example, if quarterly data are used, the seasonal lag is 4; if monthly data are used the seasonal lag is 12; and so on.
ARCH(Autoregressive Conditional Heteroskedasticity 异方差)
When examining a single time series, such as an AR model, autoregressive conditional heteroskedasticity(ARCH) exists if the variance of the residuals in one period is dependent on the variance of the residuals in a previous period. When this condition exists, the standard errors of the regression coefficients in AR models and the hypothesis tests of these coefficients are invalid.
Using ARCH Models
An ARCH model is used to test for autoregressive conditional heteroskedasticity. Within the ARCH framework, an ARCH(1) time series is one for which the variance of the residuals in one period is dependent on (i.e., a function of) the variance of the residuals in the preceding period. To test whether a time series is ARCH(1), the squared residuals from an estimated time-series model are regressed on the first lag of the squared residuals.
The ARCH(1) regression model is expressed as:
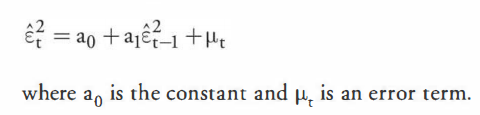
If the coefficient, a1, is statistically different from zero, the time series is ARCH(1).
If a time-series model has been determined to contain ARCH errors, regression procedures that correct for heteroskedasticity, such as generalized least squares, must be used in order to develop a predictive model. Otherwise, the standard errors of the model's coefficients will be incorrect, leading to invalid conclusions.
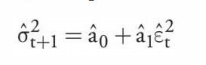
Predicting the Variance of a Time Series
However, if a time series has ARCH errors, an ARCH model can be used to predict the variance of the residuals in future periods. For example, if the data exhibit an ARCH(1) pattern, the ARCH(1) model can be used in period t to predict the variance of the residuals in period t+1:
Cointegration
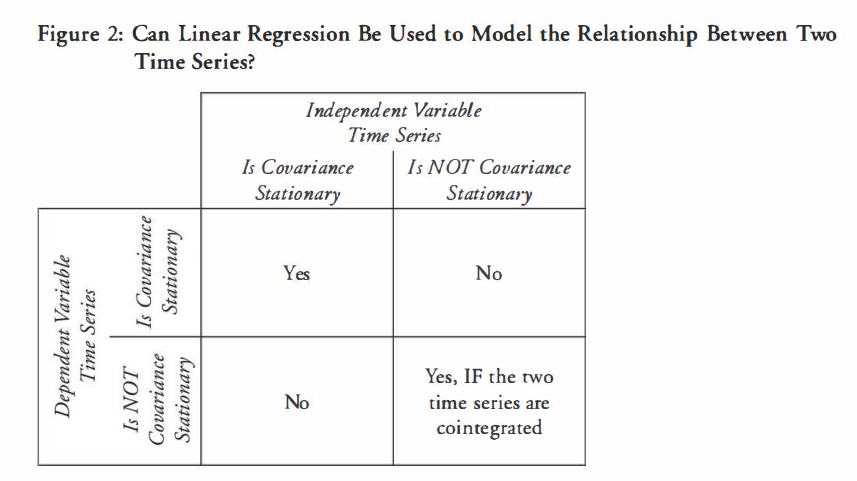
To test whether the two time series have unit roots, the analyst first runs separate DF tests with five possible results:
- Both time series are covariance stationary
- Only the dependent variable time series is covariance stationary
- Only the independent variable time series is covariance stationary
- Neither time series is covariance stationary and the two series are not cointegrated
- Neither time series is covariance stationary and the two series are cointegrated
In scenario 1 the analyst can use linear regression, and the coefficients should be statistically reliable, but regressions in scenarios 2 and 3 will not be reliable. Whether linear regression can be used in scenarios 4 and 5 depends upon whether the two time series are cointegrated.
Cointegration
Cointegration means that two time series are economically linked (related to the same macro variables) or follow the same trend and that relationship is not expected to change. If two time series are cointegrated, the error term from regression one on the other is covariance stationary and the t-tests are reliable. This means that scenario 5 will produce reliable regression estimates, whereas scenario 4 will not.
To test whether two time series are cointegrated, we regress one variable on the other using the following model:
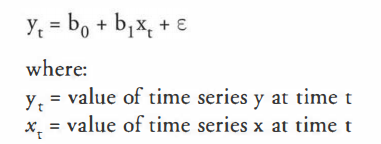
The residuals are tested for a unit root using the Dickey Fuller test with critical t-values calculated by Engle and Granger (i.e., the DF-EG test). If the test rejects the null hypothesis of a unit root, we say the error terms generated by the two time series are covariance stationary and the two series are cointegrated. If the two series are cointegrated, we can use the regression to model their relationship.
Determine the Appropriate Time-Series Model
-
Determine your goal
- Are you attempting to model the relationship of a variable to other variables (e.g., cointegrated time series, cross-sectional multiple regression)?
- Are you trying to model the variable over time (e.g. trend model)?
-
If you have decided on using a time series analysis for an individual variable, plot the values of the variable over time and look for characteristics that would indicate nonstationarity, such as non-constant variance(heteroskedasticity), non-constant mean, seasonality, or structural change.
Structural Change
A structural change is indicated by a significant shift in the plotted data at a point in time that seems to divide the data into two or more distinct patterns. In this case, you have to run two or more different models, and test whether the time series has actually shifted. If the time series has shifted significantly, a single time series encompassing the entire period will likely produce unreliable results.
-
If there is no seasonality or structural shift, use a trend model.
- If the data plot on a straight line with an upward or downwardd slope, use a linear trend model.
- If the data plot in a curve, use a log-linear trend model.
-
Run the trend analysis, compute the residuals, and test for serial correlation using the Durbin Watson test.
- If you detect no serial correlation, you can use the model.
- If you detect serial correlation, you must use another model. (e.g. AR)
-
If the data has serial correlation, reexamine the data for stationarity before running an AR model. If it is not stationary, treat the data for use in an AR model as follows:
- If the data has a linear trend, first-difference the data
- If the data has exponential trend, first-difference the natural log of the data
- If there is a structural shift in the data, run two separate models
- If the data has a seasonal component, incorporate the seasonality in the AR model
-
After first-differencing in 5 above, if the series is covariance stationary, run an AR(1) model and test for serial correlation and seasonality.
- If there is no remaining serial correlation, you can use the model.
- If you still detect serial correlation, incorporate lagged values of the variable (possible including one for seasonality-- e.g., for monthly data, add the 12th lag of the time series) into the AR model until you have removed (i.e., modeled) any serial correlation.
-
Test for ARCH. Regress the square of the residuals on squares of lagged values of the residuals and test whether the resulting coefficient is significantly different from zero.
- If the coefficient is not significantly different from zero, you can use the model.
- If the coefficient is significantly different from zero, ARCH is present. Correct using generalized least squares.
-
If you have developed two statistically reliable models and want to determine which is better at forecasting, calculating their out-of-same RMSE.
--------------------------------------
Regards,
FangwenYu


 浙公网安备 33010602011771号