MapServer Tutorial——MapServer7.2.1教程学习——第一节用例实践:Example1.2 Static Map with Two Layers
MapServer Tutorial——MapServer7.2.1教程学习——第一节用例实践:Example1.2 Static Map with Two Layers
一、前言
上一篇博客《MapServer Tutorial——MapServer7.2.1教程学习——第一节用例实践:Example1.1 A map with single layer》中介绍了单图层的地图加载显示。下面根据官网的例子介绍两个图层的加载显示。官网地址:https://www.mapserver.org/tutorial/example1-2.html#example1-2。
翻译对于我而言只是一个过程,主要是自己边翻译,边实践,边记载。
二、实现 Static Map with Two Layers
1.Static Map with Two Layers例子实践前说明
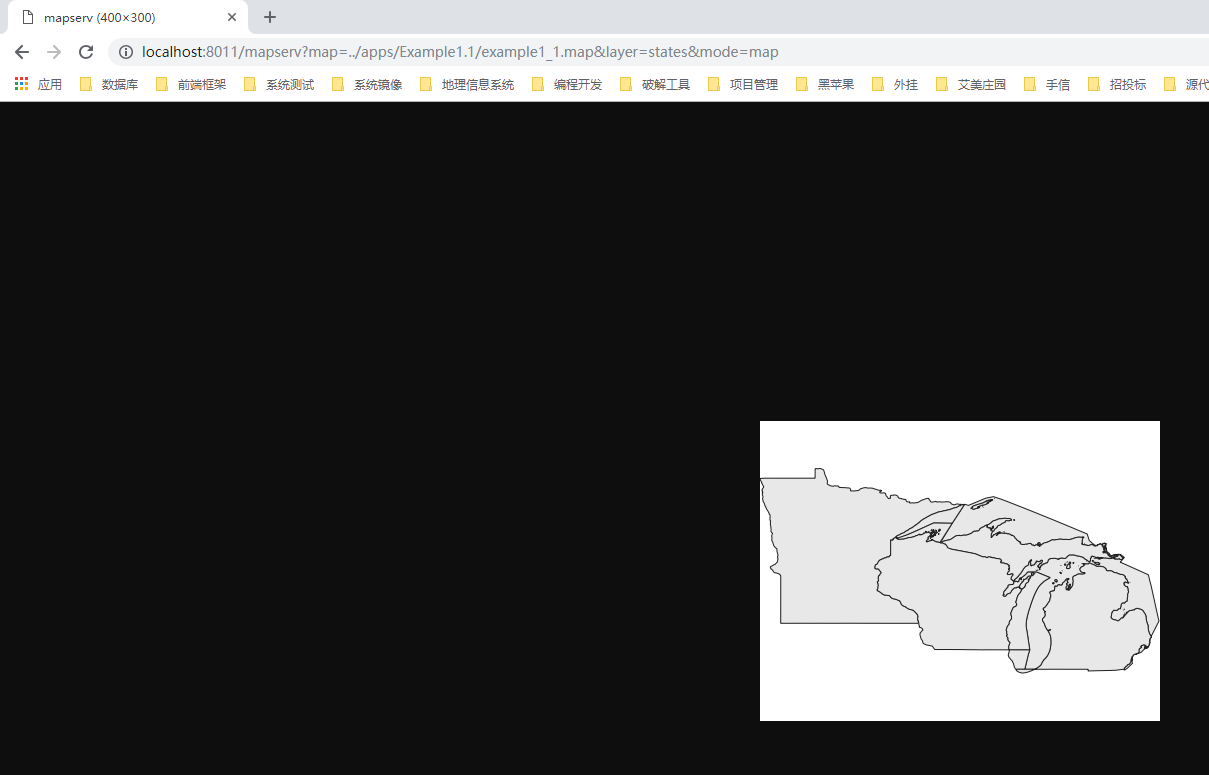
上一个例子中,通过打开:http://localhost:8011/mapserv?map=../apps/Example1.1/example1_1.map&layer=states&mode=map实现地图图片的生成。这是本节中大多数例子工作方式。
但是Static Map with Two Layers 这个例子的mapfile文件不一样。
2.准备创建站点
老规矩,老规则。在E:\SvnWorkspace\LY_WEB_GIS\branches\Documents\ms4w-mapserver-for-wimdows\release-1911-x64-gdal-2-3-3-mapserver-7-2-1\apps文件夹下面创建Example1.2文件夹
在Example1.2文件下面创建data、logs文件夹,以及 web.config、example1_2.map文件
在cmd中输入:cd /d E:\SvnWorkspace\LY_WEB_GIS\branches\Documents\ms4w-mapserver-for-wimdows\release-1911-x64-gdal-2-3-3-mapserver-7-2-1\apps
在cmd中输入:md Example1.2
在cmd中输入:cd Example1.2
在cmd中输入:md data
在cmd中输入:md logs
在cmd中输入:cd.>web.config
在cmd中输入:cd.>example1_2.map
web.config文件如下:
1 <?xml version="1.0" encoding="UTF-8"?>
2 <configuration>
3     <system.webServer>
4         <handlers>
5             <add name="MapServerFastCgi"
            path="*"
            verb="*"
            type="" modules="FastCgiModule" scriptProcessor="E:\SvnWorkspace\LY_WEB_GIS\branches\Documents\ms4w-mapserver-for-wimdows\release-1911-x64-gdal-2-3-3-mapserver-7-2-1\bin\mapserv.exe"
            resourceType="Unspecified" requireAccess="Script" allowPathInfo="false" preCondition=""  />
6         </handlers>
7         <caching enabled="true" enableKernelCache="true" />
8     </system.webServer>
9 </configuration>
example1_2.map格式如下:
MAP
  IMAGETYPE      PNG
  EXTENT         -97.238976 41.619778 -82.122902 49.385620
  SIZE           400 300
  SHAPEPATH      "./data"
  IMAGECOLOR     255 255 255

  # Layer objects are defined beneath the map object.  You need at least one
  # layer defined in your map file before you can display a map...  You can
  # define as many layers as you'd like although a limit is typically hard-coded
  # in map.h in the MapServer source.  The default limit is set at 100.  You'd
  # have to have a very specialized application to need more than 100 layers in
  # your application.

  # Start of LAYER DEFINITIONS ---------------------------------------------
  LAYER # States polygon layer begins here
    NAME         states_poly
    DATA         states_ugl
    STATUS       OFF
    TYPE         POLYGON

    # The class object is defined within the layer object.  You can define as
    # many classes as you need (well, there are limits as with layers, but it's
    # senseless to define more than ten on a "normal" layer.  There are
    # situations, however, where you might have to do it.)
    CLASS
      NAME       "States"

      # There are styles in a class, just like there are classes in a layer,
      # just like there are layers in a map.  You can define multiple styles in
      # a class just as you can define multiple classes in a layer and multiple
      # layers in a map.
      STYLE
        COLOR    232 232 232
      END
    END
  END # States polygon layer ends here

  LAYER # States line layer begins here
    NAME         states_line
    DATA         states_ugl
    STATUS       OFF
    TYPE         LINE

    CLASS
      NAME       "State Boundary"
      STYLE
        COLOR    255 0 0
      END
    END
  END # States line layer ends here
  # End of LAYER DEFINITIONS -------------------------------
  DEBUG 5
  CONFIG "MS_ERRORFILE" "logs\ms.log"
END
打开cmd输入:icacls "E:\SvnWorkspace\LY_WEB_GIS\branches\Documents\ms4w-mapserver-for-wimdows\release-1911-x64-gdal-2-3-3-mapserver-7-2-1\apps\Example1.2\logs" /grant "IIS AppPool\Example1.2":(OI)(CI)RW
是MapServer对logs文件夹有读写权限
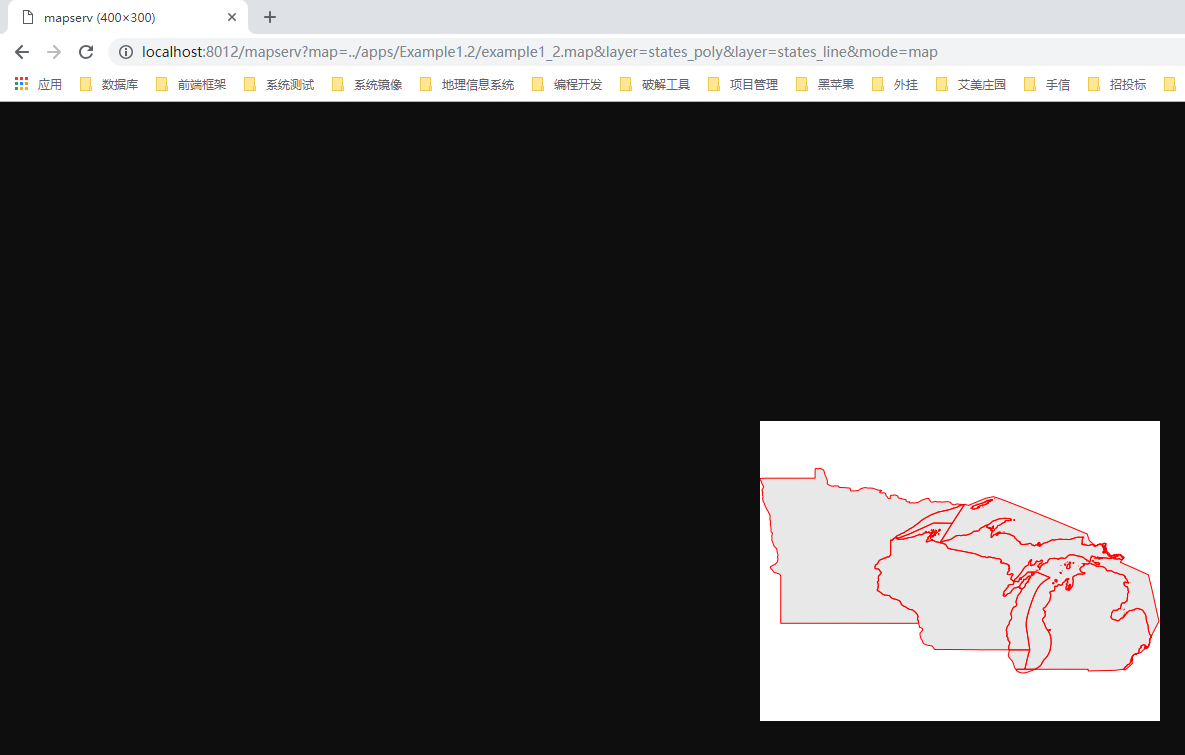
在浏览器中输入:http://localhost:8012/mapserv?map=../apps/Example1.2/example1_2.map&layer=states_poly&layer=states_line&mode=map
3.URL参数说明
map=../apps/Example1.2/example1_2.map 表示 MapServer 与 mapfile(example1_2.map)的相对路径
layer=states_poly 表示打开 NAME 值为 states_poly 的 polygon(多边形)layer层
layer=states_line 表示打开 NAME 值为 states_line 的 line(线)layer层
mode=map 表示告诉MapServer对mapfile文件的输出格式,这里是告诉MapServer直接将图像投影到浏览器,无需先在服务器端创建零时的图像。
在 mapfile(example1_2.map)中 NAME 值为 states_line 的 line(线)layer层的 CLASS 对象的 COLOR 255 0 0 表示红色,顾浏览器中的边线为红色。
三、Mapfile结构解释说明
其结构如下:
           MAP
      LAYER-|-LAYER
   CLASS-|     |-CLASS
STYLE-|           |-STYLE
在这个mapfile里面,我们将原始层分为两层。第一层是多边层(polygon)layer,但是第一层没有边线颜色(OUTLINECOLOR)设置。(其实通过OUTLINECOLOR设置第一个层也可以实现上图红色边线的视觉效果,但是现在学习的是用两个层来表示)。
第二个层将TYPE对象值由POLYGON修改为LINE,然后设置了 COLOR 对象值为 255 0 0 表示红色。
那么TYPE对象有几种值,然后又是如何区分的呢?详见:https://www.mapserver.org/mapfile/layer.html。
其中对TYPE对象的定义如下:
TYPE [chart|circle|line|point|polygon|raster|query](这个中括号里面竖线分割的就是TYPE对象的各种值)
Specifies how the data should be drawn. Need not be the same as the shapefile type. For example, a polygon shapefile may be drawn as a point layer, but a point shapefile may not be drawn as a polygon layer. Common sense rules.
In order to differentiate between POLYGONs and POLYLINEs (which do not exist as a type), simply respectively use or omit the COLOR keyword when classifying.
If you use it, it’s a polygon with a fill color, otherwise it’s a polyline with only an OUTLINECOLOR.
A circle must be defined by a a minimum bounding rectangle. That is, two points that define the smallest square that can contain it. These two points are the two opposite corners of said box. The following is an exampl using inline points to draw a circle:
LAYER
  NAME 'inline_circles'
  TYPE CIRCLE
  STATUS ON
  FEATURE
    POINTS
      74.01 -53.8
      110.7 -22.16
    END
  END
  CLASS
    STYLE
      COLOR 0 0 255
    END
  END
END
TYPE query means the layer can be queried but not drawn.
Note TYPE annotation has been deprecated since version 6.2. Identical functionality can be obtained by adding LABEL level STYLE blocks, and do not require loading the datasets twice in two different layers as was the case with layers of TYPE annotation.
See also The Dynamic Charting HowTo for TYPE chart.
(后续我也肯定会写各种TYPE值的实现,毕竟是自己学习的过程)
四、为什么这么做而不直接在第一个层中定义OUTLINECOLOR呢?
如果我们继续在状态层的顶部添加层,那么轮廓很可能会被这些其他层覆盖。为了在添加这些其他层之后仍能看到状态边界,我们必须将状态边界线层与状态多边形层分离,并将其放在其他层的顶部。我们如何定义/添加层是有顺序的。
五、后记
这节案例中,其实学到的东西分为以下几点:
1.强化记忆了mapfile的应用
2.对 LAYER 对象中 TYPE 对象有了更加明确的认识
3.运用了多个层,知道为什么要这么用。目前还不明白MapServer中,层的顺序是否是按照mapfile中定义的顺序加载的。如:一个layer是最下面,然后一级一级的网上放。有待资料查询和证实。

 浙公网安备 33010602011771号