文献阅读 | High-resolution genetic mapping of maize pan-genome sequence anchors
Lu, F., Romay, M., Glaubitz, J. et al. High-resolution genetic mapping of maize pan-genome sequence anchors. Nat Commun 6, 6914 (2015). https://doi.org/10.1038/ncomms7914
由于测序成本的下降,现在有可能以前所未有的规模在深度和样本数量上对农作物品种进行测序。但是,由于复杂基因组的repetitive nature,普遍的比对歧义性阻碍了准确的阅读重叠,并混淆了全基因组组装。此外,参考基因组中缺少的大部分基因组片段无法通过比对放置在pan-genome上。因此,对于具有复杂基因组的物种,仅靠序列比对不足以建立高质量的泛基因组。但是,一组可用的超高密度遗传锚点将对泛基因组的构建极有帮助。这些遗传锚可以用于评估装配质量,甚至可以更好地指导从头开始进行个别基因组的组装。GBS可以为物种的大量个体有效地产生丰富的单核苷酸多态性(SNP)。它也是序列标签的一种经济有效的来源,可以用作遗传锚点,以指导重叠群/支架组装并映射参考基因组中不存在的基因组片段。
作者测定了14129个玉米自交系中的样本,寻找到了2600万个GBS tag。同时,测序结果在B73上找到了681,257个SNP。
通过将GBS tag与SNP进行关联分析,可以将B73上实际不存在的GBS tag(及其代表的基因组片段)锚定到B73基因组上,进而得以明确该PAV片段在pan-genome上的位置。(假设B73为core-genome,示意图见Fig.1 (e))
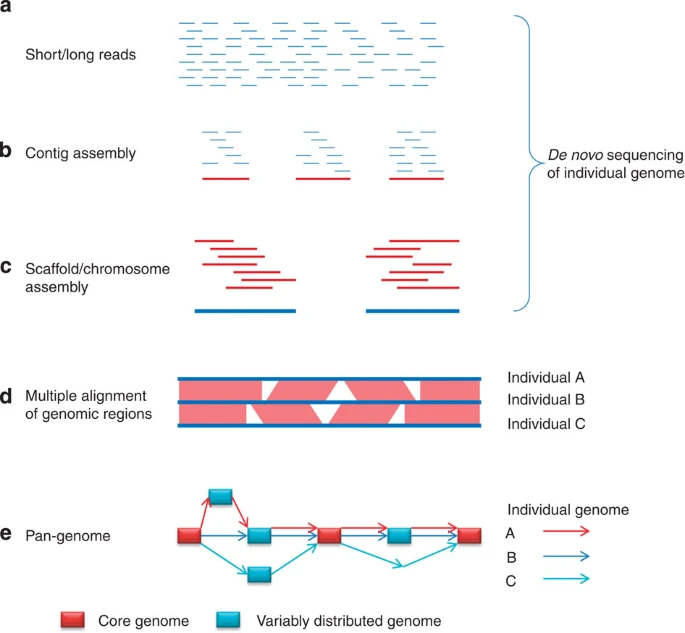
Fig 1
(a) Individual genome is randomly sheared and sequenced using either short or long read sequencing technologies. (b) Contig assembly using reads. The contigs are usually generated with k-mers using de Bruijn graph-based algorithms. (c) Scaffold/chromosome assembly on the basis of contigs. (d) Identifying structural variations by sequence alignment. (e) The graph of the pan-genome. The rectangles represent genomic sequence. Red rectangles are sequences from the core genome, in which sequences are present in all individuals. Blue rectangles are sequences from the variable distributed genome, which show structural variations. Individual genomes are represented by these rectangles connected with arrows.
对于从14K个自交系中得到的26M个GBS tag,作者得到了700K个SNP,并通过结合使用了遗传图谱方法与机器学习(ML)算法,将这14K个GBS标签锚定到B73参考基因组上。通过测试每个标签的PAV模式与14K个玉米自交系中各个GBS SNP基因型之间的关联,对GBS标签进行了遗传定位,其中最高SNP的位置被视为玉米的遗传位置。
原始的序列读段被按照GBS reference pipeline in TASSEL version 3.0进行处理。在该流程中,Illumina的读数被trimmed为64 bp。相同的64 bp读段被视为GBS标签。 具有minimum read count of 20的标签被用于genotyping。这些标签被比对到了4.38 million unique positions in B73 reference,覆盖了∼12% maize genome。Population genetic-based SNP filters were applied to filter putative SNPs. Genotypes were called using likelihood ratio test on potential genotypes.
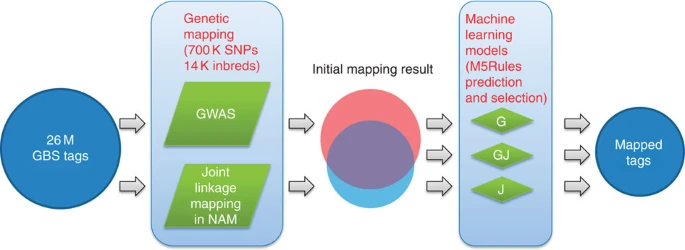
Fig 2
Two genetic mapping approaches, GWAS and joint linkage mapping in NAM, are performed to map GBS tags. Since some tags are mapped by the two methods and others are mapped by both, three corresponding ML models are trained to predict and select accurately mapped tags.
随后对于定位结果,作者采用了机器学习的方法预测定位的准确性,并将准确映射的标签记为序列锚点。
机器学习模型共选择出了4,436,135个high-resolution tags。其中,406,019 were UABTs(唯一且完美比对到B73上的)。这些UABTs中 99.1% 被分配到了正确的染色体上, 95.0% 的与其实际位置相距不足1Mb且54.8% 不到10 kb。Of the 4.4 M anchor tags, 946,711 were B73 tags (present in B73 samples): 94% of these B73 tags had a unique perfect alignment match to the reference. This indicates that the 4.4-M mapped tags were enriched for low copy sequences. Therefore, the majority of mapped tags appear to qualify as unique sequence anchors for the maize pan-genome.
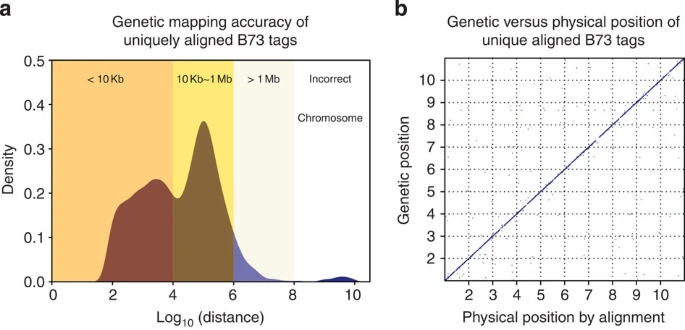
Fig 4
A total of 20,000 randomly chosen UABTs were used as a quality control to evaluate the performance of genetic mapping. (a) The distribution of distance between genetic position and physical position (alignment position) of UABTs. Positions are transformed with an equation of pos=chromosome × 1E9+pos. (b) The scatter plot of genetic position against physical position of UABTs. The x and y axes are maize chromosomes.
对于大量的无法比对到参考基因组,或比对位置与其遗传位置距离大于10Mb的tag,作者定义其为PAV。其基本上标记了B73参考基因组直系同源区域中不存在的基因组序列。比对采用了Bowtie2(with very-sensitive-local option)
大约0.5%的B73标签在遗传位置和物理位置之间没有一致性。这可能是由于两个原因:(1)由于易位或重复,同一标签在非B73基因组中位于另一个位置;(2)4.4-M标签的遗传位置不在其实际位置的10-Mb区域中的可能性约为1.4%。
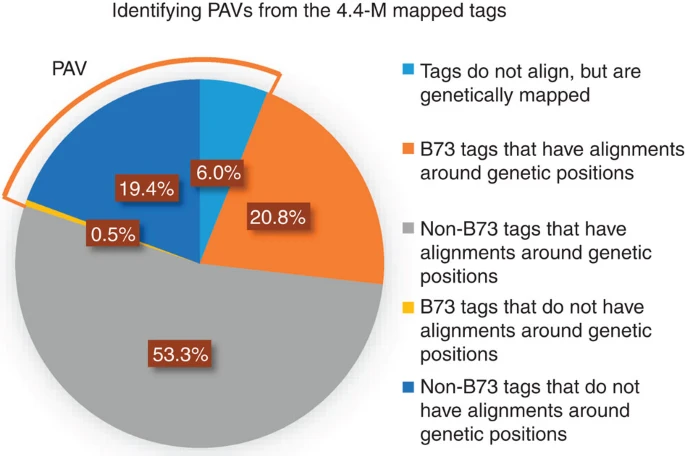
Fig 5
The 4.4-M mapped tags were aligned to the B73 reference genome and the physical positions were compared with their genetic positions. If a tag did not align to the reference or did not have alignment within the 10-Mb region of its genetic position, then it would be considered as a PAV tag. The B73 tags are those that have at least one perfect match to the reference genome.
为了启动玉米全基因组的构建,作者“最近”对玉米自交系CML247进行了深度测序和组装,该系由于其高抗病性而成为玉米育种的宝贵系。事实证明,4.4-M遗传锚点是评估CML247组装质量的有力资源
另外,QQ图展示,PAV对一些重要表型由所贡献
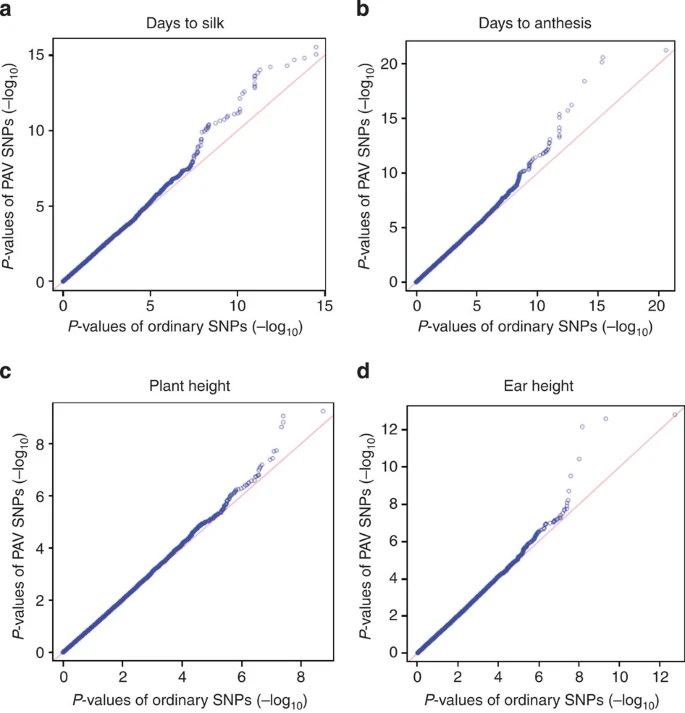
Fig 6
For the large amount of insignificant SNPs, the PAV SNPs and ordinary SNPs did not show differentiated distributions; while for those significant GWAS hits, PAV SNPs exhibited enriched associations with traits.

 浙公网安备 33010602011771号