

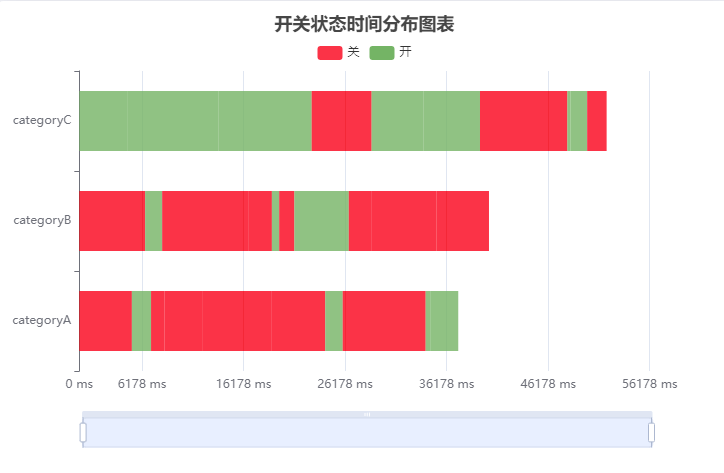
echarts开关状态时间分布图显示
状态有两种开关,看在一天的时间线上什么时间是开,什么时间是关的图表
这个图表是根据性能分析图改变而来的
效果如下:
代码如下,下面粘的是这个代码,直接放在echarts代码编辑中就能运行。
这里说一句,因为性能分析图显示不出来图例,所有在代码中我用力一点障眼法,如果有更好的办法欢迎告诉我
关键变更代码 ,
[index, baseTime, (baseTime += duration), duration]
index是类目轴,例如:‘categoryA’
baseTime:开始时间
(baseTime += duration) 结束时间
duration 值(这里说多少秒)

// categoryIndex确定哪个类目,开始、结束、类目的高度
var categoryIndex = api.value(0);
var start = api.coord([api.value(1), categoryIndex]);
var end = api.coord([api.value(2), categoryIndex]);
var height = api.size([0, 1])[1] * 0.6;
var data = [];
var dataCount = 10;
var startTime = +new Date();
var categories = ['categoryA', 'categoryB', 'categoryC'];
var types = [
{ name: '关', color: '#f00' },
{ name: '开', color: '#72b362' }
];
// Generate mock data
categories.forEach(function (category, index) {
var baseTime = startTime;
for (var i = 0; i < dataCount; i++) {
var typeItem = types[Math.round(Math.random() * (types.length - 1))];
var duration = Math.round(Math.random() * 10000);
data.push({
name: typeItem.name,
value: [index, baseTime, (baseTime += duration), duration],
itemStyle: {
normal: {
color: typeItem.color
}
}
});
// baseTime += Math.round(Math.random() * 2000);
}
});
console.log(data,'---数据')
let renderitemNum=0 // 测试循环次数计数,可进行删除
function renderItem(params, api) {
renderitemNum+=1
var categoryIndex = api.value(0);
var start = api.coord([api.value(1), categoryIndex]);
var end = api.coord([api.value(2), categoryIndex]);
var height = api.size([0, 1])[1] * 0.6;
// console.log(categoryIndex,start,end,height,'次数--',renderitemNum,'接收参数---',params, api)
var rectShape = echarts.graphic.clipRectByRect(
{
x: start[0],
y: start[1] - height / 2,
width: end[0] - start[0],
height: height
},
{
x: params.coordSys.x,
y: params.coordSys.y,
width: params.coordSys.width,
height: params.coordSys.height
}
);
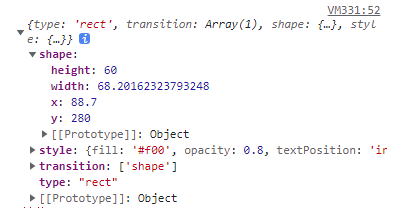
console.log((
rectShape && {
type: 'rect',
transition: ['shape'],
shape: rectShape,
style: api.style()
}
),'计数---',renderitemNum,rectShape)
return (
rectShape && {
type: 'rect',
transition: ['shape'],
shape: rectShape,
style: api.style()
}
);
}
option = {
tooltip: {
formatter: function (params) {
return params.marker + params.name + ': ' + params.value[3] + ' ms';
}
},
title: {
text: '开关状态时间分布图表',
left: 'center'
},
legend: {
show:true,
left:'center',
top:30
// data:types
},
color:['#f00','#72b362'],
dataZoom: [
{
type: 'slider',
filterMode: 'weakFilter',
showDataShadow: false,
top: 400,
labelFormatter: ''
},
{
type: 'inside',
filterMode: 'weakFilter'
}
],
grid: {
height: 300
},
xAxis: {
min: startTime,
scale: true,
axisLabel: {
formatter: function (val) {
return Math.max(0, val - startTime) + ' ms';
}
}
},
yAxis: {
data: categories
},
series: [
{
type: 'custom',
renderItem: renderItem,
name:'关',
itemStyle: {
opacity: 0.8
},
encode: {
x: [1, 2],
y: 0
},
data: data
},
{
type: 'custom',
name:'开',
}
]
};

 浙公网安备 33010602011771号