ELK日志分析系统之Kibana7.x最新版安装与配置
3、Kibana的简介
Kibana 让您能够自由地选择如何呈现自己的数据。Kibana 核心产品搭载了一批经典功能:柱状图、线状图、饼图、旭日图等等。
3.1、软件包下载地址:https://www.elastic.co/cn/downloads/kibana
3.1.1 软件包tar压缩包,解压到/application目录中,并创建链接文件。
ln -s /application/kibana-7.3.2-linux-x86_64 /application/kibana
3.2、配置Kibana服务的配置文件/application/kibana/config/kibana.yml
# Kibana is served by a back end server. This setting specifies the port to use.
server.port: 5601   #kibana端口

# Specifies the address to which the Kibana server will bind. IP addresses and host names are both valid values.
# The default is 'localhost', which usually means remote machines will not be able to connect.
# To allow connections from remote users, set this parameter to a non-loopback address.
server.host: "10.0.0.169"    #绑定的主机IP地址

# Enables you to specify a path to mount Kibana at if you are running behind a proxy.
# Use the `server.rewriteBasePath` setting to tell Kibana if it should remove the basePath
# from requests it receives, and to prevent a deprecation warning at startup.
# This setting cannot end in a slash.
#server.basePath: ""

# Specifies whether Kibana should rewrite requests that are prefixed with
# `server.basePath` or require that they are rewritten by your reverse proxy.
# This setting was effectively always `false` before Kibana 6.3 and will
# default to `true` starting in Kibana 7.0.
#server.rewriteBasePath: false

# The maximum payload size in bytes for incoming server requests.
#server.maxPayloadBytes: 1048576

# The Kibana server's name.  This is used for display purposes.
#server.name: "your-hostname"

# The URLs of the Elasticsearch instances to use for all your queries.
elasticsearch.hosts: ["http://10.0.0.169:9200"]      #elasticsearch的主机IP

# When this setting's value is true Kibana uses the hostname specified in the server.host
# setting. When the value of this setting is false, Kibana uses the hostname of the host
# that connects to this Kibana instance.
#elasticsearch.preserveHost: true

# Kibana uses an index in Elasticsearch to store saved searches, visualizations and
# dashboards. Kibana creates a new index if the index doesn't already exist.
kibana.index: ".kibana"     #开启此选项

# The default application to load.
#kibana.defaultAppId: "home"

# If your Elasticsearch is protected with basic authentication, these settings provide
# the username and password that the Kibana server uses to perform maintenance on the Kibana
# index at startup. Your Kibana users still need to authenticate with Elasticsearch, which
# is proxied through the Kibana server.
#elasticsearch.username: "kibana"
#elasticsearch.password: "pass"

# Enables SSL and paths to the PEM-format SSL certificate and SSL key files, respectively.
# These settings enable SSL for outgoing requests from the Kibana server to the browser.
#server.ssl.enabled: false
#server.ssl.certificate: /path/to/your/server.crt
#server.ssl.key: /path/to/your/server.key

# Optional settings that provide the paths to the PEM-format SSL certificate and key files.
# These files validate that your Elasticsearch backend uses the same key files.
#elasticsearch.ssl.certificate: /path/to/your/client.crt
#elasticsearch.ssl.key: /path/to/your/client.key

# Optional setting that enables you to specify a path to the PEM file for the certificate
# authority for your Elasticsearch instance.
#elasticsearch.ssl.certificateAuthorities: [ "/path/to/your/CA.pem" ]

# To disregard the validity of SSL certificates, change this setting's value to 'none'.
#elasticsearch.ssl.verificationMode: full

# Time in milliseconds to wait for Elasticsearch to respond to pings. Defaults to the value of
# the elasticsearch.requestTimeout setting.
#elasticsearch.pingTimeout: 1500

# Time in milliseconds to wait for responses from the back end or Elasticsearch. This value
# must be a positive integer.
#elasticsearch.requestTimeout: 30000

# List of Kibana client-side headers to send to Elasticsearch. To send *no* client-side
# headers, set this value to [] (an empty list).
#elasticsearch.requestHeadersWhitelist: [ authorization ]

# Header names and values that are sent to Elasticsearch. Any custom headers cannot be overwritten
# by client-side headers, regardless of the elasticsearch.requestHeadersWhitelist configuration.
#elasticsearch.customHeaders: {}

# Time in milliseconds for Elasticsearch to wait for responses from shards. Set to 0 to disable.
#elasticsearch.shardTimeout: 30000

# Time in milliseconds to wait for Elasticsearch at Kibana startup before retrying.
#elasticsearch.startupTimeout: 5000

# Logs queries sent to Elasticsearch. Requires logging.verbose set to true.
#elasticsearch.logQueries: false

# Specifies the path where Kibana creates the process ID file.
#pid.file: /var/run/kibana.pid

# Enables you specify a file where Kibana stores log output.
#logging.dest: stdout

# Set the value of this setting to true to suppress all logging output.
#logging.silent: false

# Set the value of this setting to true to suppress all logging output other than error messages.
#logging.quiet: false

# Set the value of this setting to true to log all events, including system usage information
# and all requests.
#logging.verbose: false

# Set the interval in milliseconds to sample system and process performance
# metrics. Minimum is 100ms. Defaults to 5000.
#ops.interval: 5000

# Specifies locale to be used for all localizable strings, dates and number formats.
# Supported languages are the following: English - en , by default , Chinese - zh-CN .
i18n.locale: "zh-CN"     #kibana默认文字是英文,变更成中文
3.3、启动kibana
如果使用root用户启动服务,后面必须加--allow-root选项。
[root@harlan_ansible ~]# /application/kibana/bin/kibana --allow-root
3.4、通过浏览器访问地址:http://10.0.0.169:5601
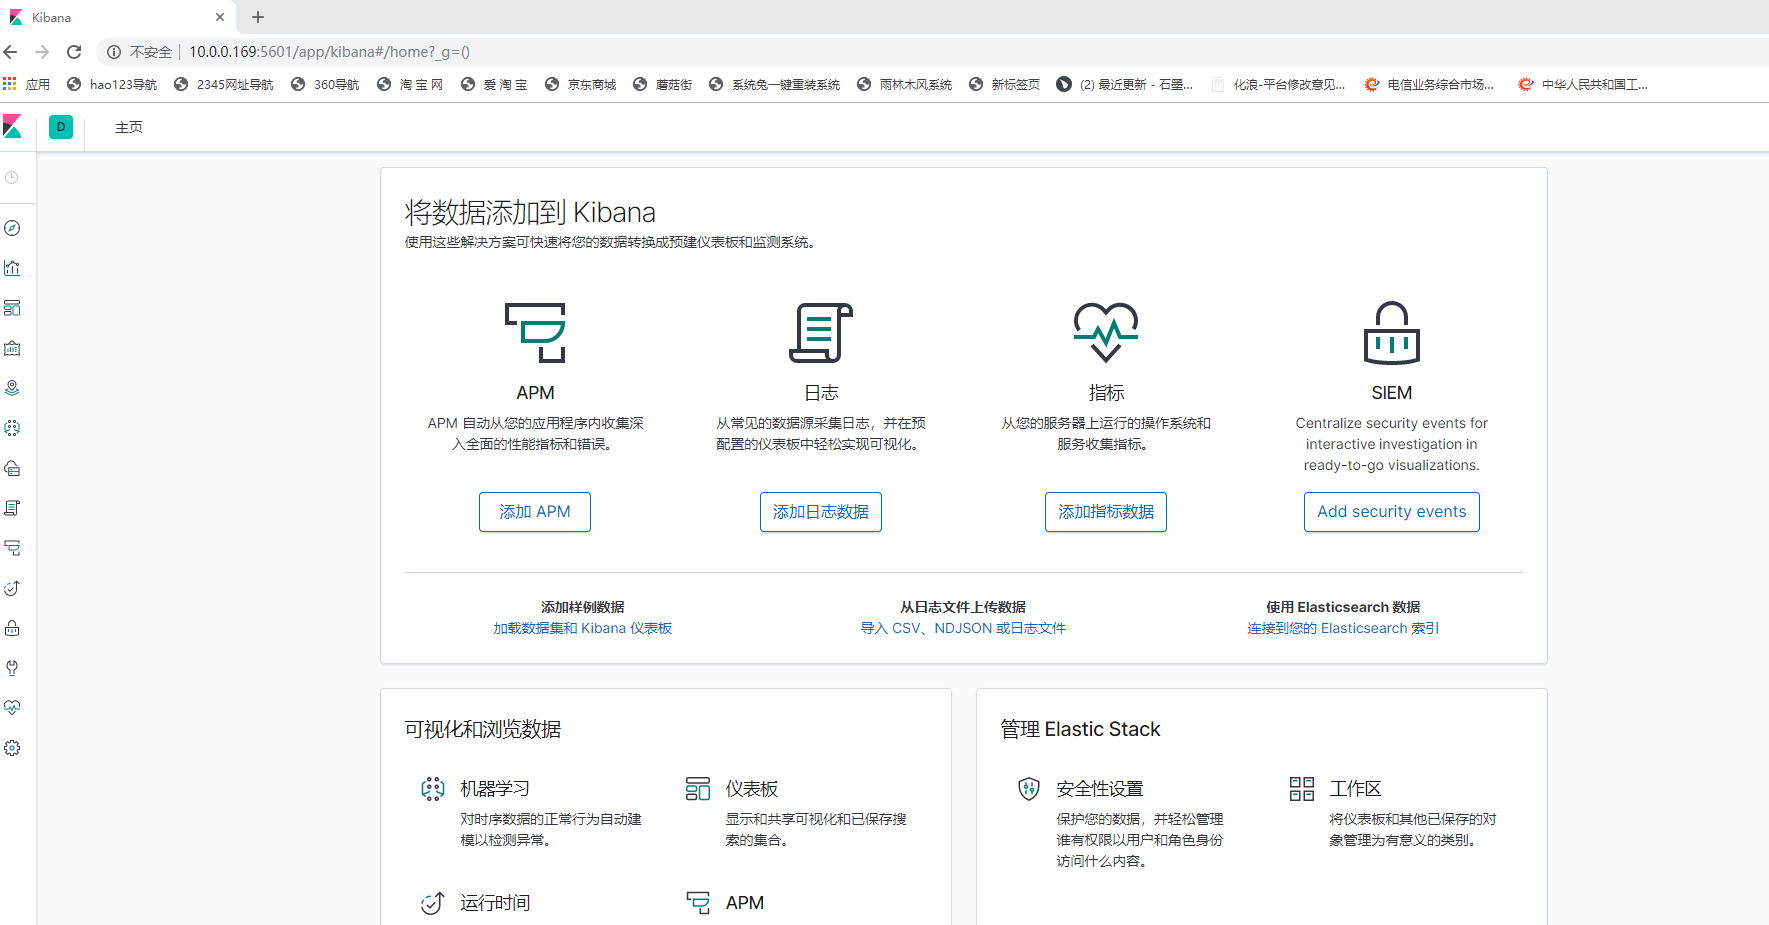
由上述可知,kibana服务安装和配置成功。
3.5、通过访问kibana浏览器,我们可以直接在需要收集日志的主机上安装Beats软件,不需要在ELK主机上安装Logstash软件包。
通过配置Beats服务的配置文件,来收集不同服务的日志。
3.5.1、例收集客户机的tomcat服务器访问日志文件
客户机IP:10.0.0.175
ELK服务器的IP:10.0.0.169
 curl -L -O https://artifacts.elastic.co/downloads/beats/filebeat/filebeat-7.3.2-x86_64.rpm
sudo rpm -vi filebeat-7.3.2-x86_64.rpm
编辑配置
修改 /etc/filebeat/filebeat.yml 以设置连接信息:
###################### Filebeat Configuration Example #########################
# This file is an example configuration file highlighting only the most common
# options. The filebeat.reference.yml file from the same directory contains all the
# supported options with more comments. You can use it as a reference.
#
# You can find the full configuration reference here:
# https://www.elastic.co/guide/en/beats/filebeat/index.html
# For more available modules and options, please see the filebeat.reference.yml sample
# configuration file.
#=========================== Filebeat inputs =============================
filebeat.inputs:
# Each - is an input. Most options can be set at the input level, so
# you can use different inputs for various configurations.
# Below are the input specific configurations.
- type: log
# Change to true to enable this input configuration.
enabled: true #开启,由false变成true
# Paths that should be crawled and fetched. Glob based paths.
paths:
- /var/log/*.log #默认系统日志路径
#- c:\programdata\elasticsearch\logs\*
# Exclude lines. A list of regular expressions to match. It drops the lines that are
# matching any regular expression from the list.
#exclude_lines: ['^DBG']
# Include lines. A list of regular expressions to match. It exports the lines that are
# matching any regular expression from the list.
#include_lines: ['^ERR', '^WARN']
# Exclude files. A list of regular expressions to match. Filebeat drops the files that
# are matching any regular expression from the list. By default, no files are dropped.
#exclude_files: ['.gz$']
# Optional additional fields. These fields can be freely picked
# to add additional information to the crawled log files for filtering
#fields:
# level: debug
# review: 1
### Multiline options
# Multiline can be used for log messages spanning multiple lines. This is common
# for Java Stack Traces or C-Line Continuation
# The regexp Pattern that has to be matched. The example pattern matches all lines starting with [
#multiline.pattern: ^\[
# Defines if the pattern set under pattern should be negated or not. Default is false.
#multiline.negate: false
# Match can be set to "after" or "before". It is used to define if lines should be append to a pattern
# that was (not) matched before or after or as long as a pattern is not matched based on negate.
# Note: After is the equivalent to previous and before is the equivalent to to next in Logstash
#multiline.match: after
#============================= Filebeat modules ===============================
filebeat.config.modules:
# Glob pattern for configuration loading
path: ${path.config}/modules.d/*.yml
# Set to true to enable config reloading
reload.enabled: flase
# Period on which files under path should be checked for changes
#reload.period: 10s
#==================== Elasticsearch template setting ==========================
setup.template.settings:
index.number_of_shards: 1
#index.codec: best_compression
#_source.enabled: false
# Defines if the pattern set under pattern should be negated or not. Default is false.
#multiline.negate: false
# Match can be set to "after" or "before". It is used to define if lines should be append to a pattern
# that was (not) matched before or after or as long as a pattern is not matched based on negate.
# Note: After is the equivalent to previous and before is the equivalent to to next in Logstash
#multiline.match: after
#============================= Filebeat modules ===============================
filebeat.config.modules:
# Glob pattern for configuration loading
path: ${path.config}/modules.d/*.yml
# Set to true to enable config reloading
reload.enabled: false
# Period on which files under path should be checked for changes
#reload.period: 10s
#==================== Elasticsearch template setting ==========================
setup.template.settings:
index.number_of_shards: 1
#index.codec: best_compression
#_source.enabled: false
#================================ General =====================================
# The name of the shipper that publishes the network data. It can be used to group
# all the transactions sent by a single shipper in the web interface.
#name:
# The tags of the shipper are included in their own field with each
# transaction published.
#tags: ["service-X", "web-tier"]
# Optional fields that you can specify to add additional information to the
# output.
#fields:
# env: staging
#============================== Dashboards =====================================
# These settings control loading the sample dashboards to the Kibana index. Loading
# the dashboards is disabled by default and can be enabled either by setting the
# options here or by using the `setup` command.
#setup.dashboards.enabled: false
# The URL from where to download the dashboards archive. By default this URL
# has a value which is computed based on the Beat name and version. For released
# versions, this URL points to the dashboard archive on the artifacts.elastic.co
# website.
#setup.dashboards.url:
#============================== Kibana =====================================
# Starting with Beats version 6.0.0, the dashboards are loaded via the Kibana API.
# This requires a Kibana endpoint configuration.
setup.kibana:
# Kibana Host
# Scheme and port can be left out and will be set to the default (http and 5601)
# In case you specify and additional path, the scheme is required: http://localhost:5601/path
# IPv6 addresses should always be defined as: https://[2001:db8::1]:5601
host: "10.0.0.169:5601" #添加上kibana的主机IP
# Kibana Space ID
# ID of the Kibana Space into which the dashboards should be loaded. By default,
# the Default Space will be used.
#space.id:
#============================= Elastic Cloud ==================================
# These settings simplify using Filebeat with the Elastic Cloud (https://cloud.elastic.co/).
# The cloud.id setting overwrites the `output.elasticsearch.hosts` and
# `setup.kibana.host` options.
# You can find the `cloud.id` in the Elastic Cloud web UI.
#cloud.id:
# The cloud.auth setting overwrites the `output.elasticsearch.username` and
# `output.elasticsearch.password` settings. The format is `<user>:<pass>`.
#cloud.auth:
#================================ Outputs =====================================
# Configure what output to use when sending the data collected by the beat.
#-------------------------- Elasticsearch output ------------------------------
output.elasticsearch:
# Array of hosts to connect to.
hosts: ["10.0.0.169:9200"] #Elasticsearch主机的IP地址
# Optional protocol and basic auth credentials.
#protocol: "https"
username: "es" #启动elasticsearch的用户
password: "harlan-herine" #启动elasticsearch的用户的密码
#----------------------------- Logstash output --------------------------------
#output.logstash:
# The Logstash hosts
#hosts: ["localhost:5044"]
# Optional SSL. By default is off.
# List of root certificates for HTTPS server verifications
#ssl.certificate_authorities: ["/etc/pki/root/ca.pem"]
# Certificate for SSL client authentication
#ssl.certificate: "/etc/pki/client/cert.pem"
# Client Certificate Key
#ssl.key: "/etc/pki/client/cert.key"
#================================ Processors =====================================
# Configure processors to enhance or manipulate events generated by the beat.
processors:
- add_host_metadata: ~
- add_cloud_metadata: ~
#================================ Logging =====================================
# Sets log level. The default log level is info.
# Available log levels are: error, warning, info, debug
#logging.level: debug
# At debug level, you can selectively enable logging only for some components.
# To enable all selectors use ["*"]. Examples of other selectors are "beat",
# "publish", "service".
#logging.selectors: ["*"]
#============================== Xpack Monitoring ===============================
# filebeat can export internal metrics to a central Elasticsearch monitoring
# cluster. This requires xpack monitoring to be enabled in Elasticsearch. The
# reporting is disabled by default.
# Set to true to enable the monitoring reporter.
#monitoring.enabled: false
# Sets the UUID of the Elasticsearch cluster under which monitoring data for this
# Filebeat instance will appear in the Stack Monitoring UI. If output.elasticsearch
# is enabled, the UUID is derived from the Elasticsearch cluster referenced by output.elasticsearch.
#monitoring.cluster_uuid:
# Uncomment to send the metrics to Elasticsearch. Most settings from the
# Elasticsearch output are accepted here as well.
# Note that the settings should point to your Elasticsearch *monitoring* cluster.
# Any setting that is not set is automatically inherited from the Elasticsearch
# output configuration, so if you have the Elasticsearch output configured such
# that it is pointing to your Elasticsearch monitoring cluster, you can simply
# uncomment the following line.
#monitoring.elasticsearch:
#================================= Migration ==================================
# This allows to enable 6.7 migration aliases
#migration.6_to_7.enabled: true
其中,<password> 是 elastic 用户的密码,<es_url> 是 Elasticsearch 的 URL,<kibana_url> 是 Kibana 的 URL。
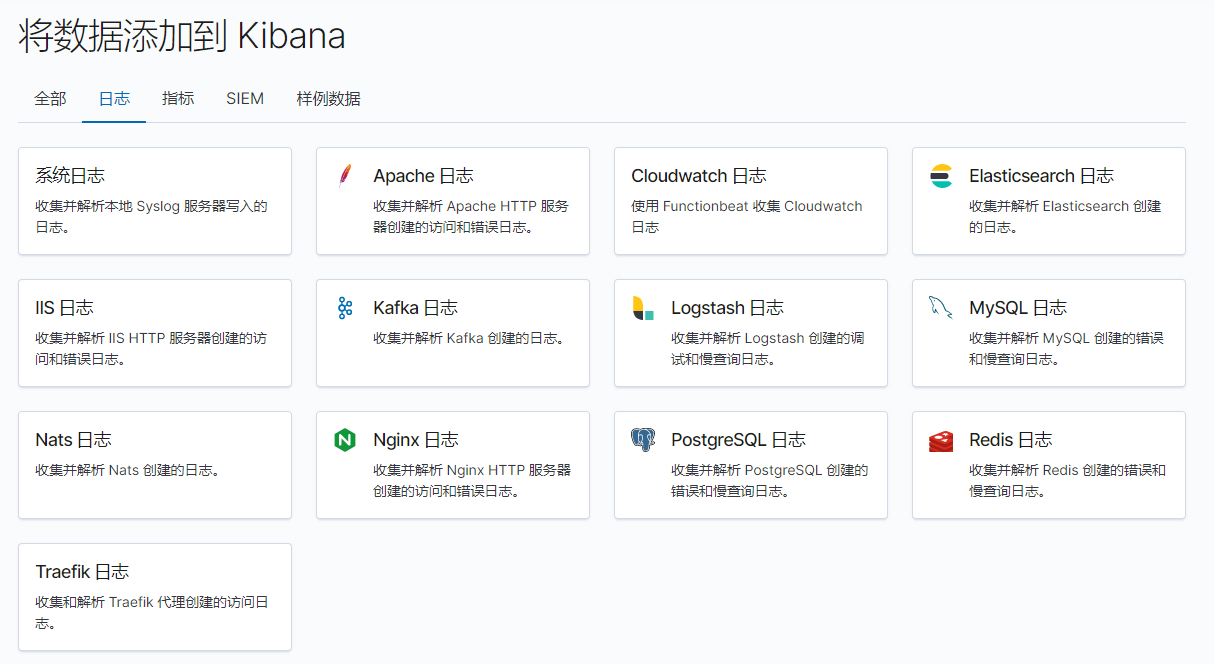
启用和配置apache模块来收集tomcat日志
filebeat modules enable apache
在 /etc/filebeat/modules.d/apache.yml 文件中修改设置。
[root@harlan-web ~]# vim /etc/filebeat/modules.d/apache.yml
  1 # Module: apache
  2 # Docs: https://www.elastic.co/guide/en/beats/filebeat/7.3/filebeat-module-apache.html
  3
  4 - module: apache
  5   # Access logs
  6   access:
  7     enabled: true
  8    var.paths: ["/application/apache-tomcat-8.5.42/logs/*"]             #web服务器tomcat日志存放目录
  9     # Set custom paths for the log files. If left empty,
 10     # Filebeat will choose the paths depending on your OS.
 11     #var.paths:
 12
 13   # Error logs
 14   error:
 15     enabled: true
 16
 17     # Set custom paths for the log files. If left empty,
 18     # Filebeat will choose the paths depending on your OS.
 19     #var.paths:
启动 Filebeat
setup 命令加载 Kibana 仪表板。如果仪表板已设置,请省略此命令。
sudo filebeat setup
sudo systemctl start filebeat.service
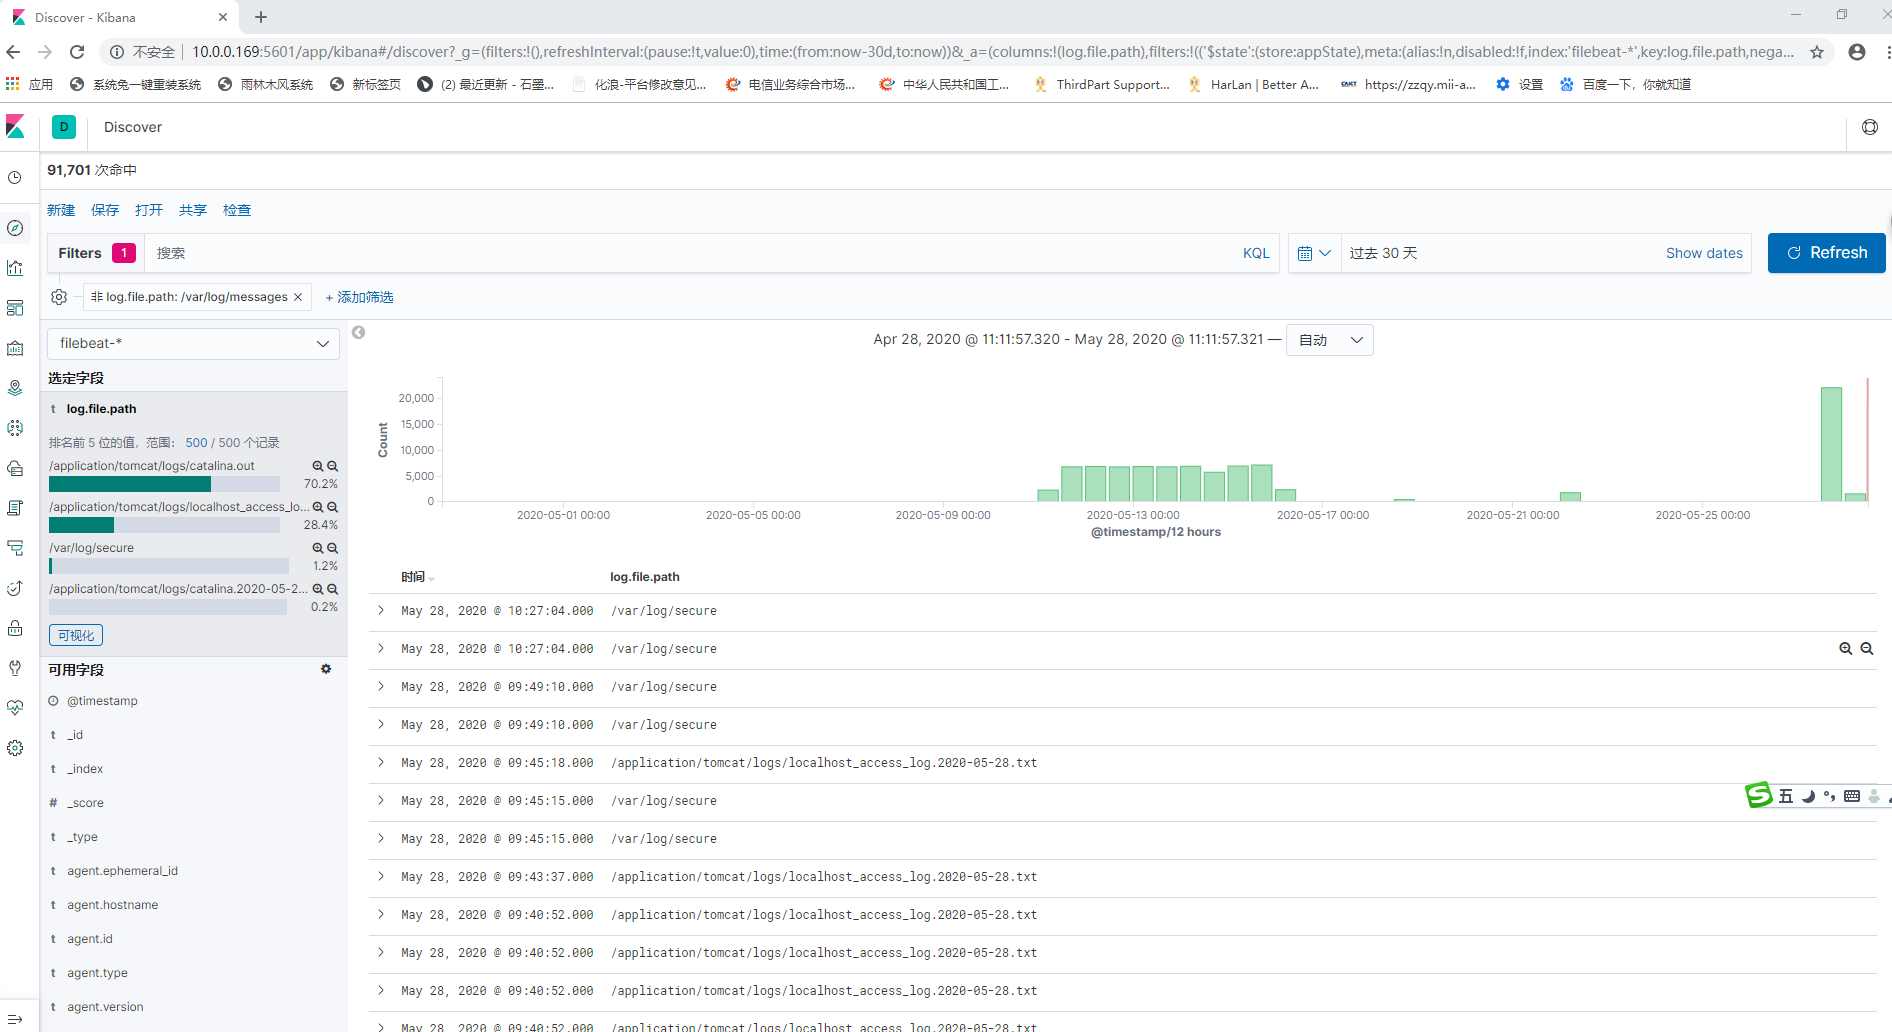
确认已从 Filebeat apache 模块成功收到数据
完成所有步骤后,您便可以随时浏览自己的数据。

 浙公网安备 33010602011771号