ELK高并发,高可用队列日志管理系统
官网地址:https://www.elastic.co/cn/
官网权威指南:https://www.elastic.co/guide/cn/elasticsearch/guide/current/index.html
安装指南:https://www.elastic.co/guide/en/elasticsearch/reference/5.x/rpm.html
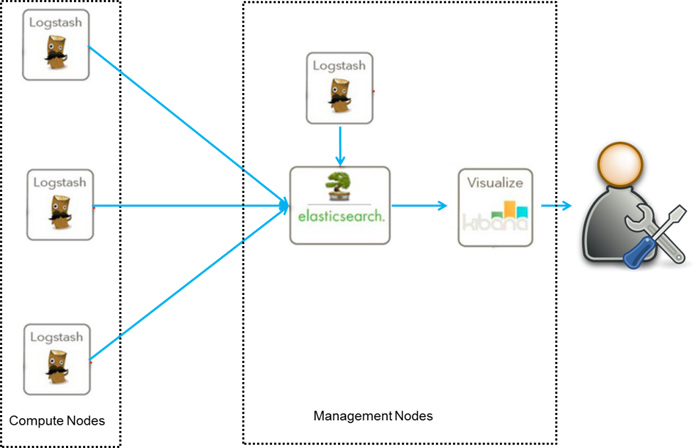
ELK是Elasticsearch、Logstash、Kibana的简称,这三者是核心套件,但并非全部。
Elasticsearch是实时全文搜索和分析引擎,提供搜集、分析、存储数据三大功能;是一套开放REST和JAVA API等结构提供高效搜索功能,可扩展的分布式系统。它构建于Apache Lucene搜索引擎库之上。
Logstash是一个用来搜集、分析、过滤日志的工具。它支持几乎任何类型的日志,包括系统日志、错误日志和自定义应用程序日志。它可以从许多来源接收日志,这些来源包括 syslog、消息传递(例如 RabbitMQ)和JMX,它能够以多种方式输出数据,包括电子邮件、websockets和Elasticsearch。
Kibana是一个基于Web的图形界面,用于搜索、分析和可视化存储在 Elasticsearch指标中的日志数据。它利用Elasticsearch的REST接口来检索数据,不仅允许用户创建他们自己的数据的定制仪表板视图,还允许他们以特殊的方式查询和过滤数据
环境
centos7 两台
10.10.3.192 安装: elasticsearch、logstash、Kibana、Nginx、Http、Redis
10.10.3.193 安装 logstash 作用:运行配置文件,从redis读取数据到elas中
1、安装elasticsearch
2、安装es的yum源
安装elasticsearch的yum源的密钥(这个需要在所有服务器上都配置)
# rpm --import https://artifacts.elastic.co/GPG-KEY-elasticsearch


cat > /etc/yum.repos.d/elasticsearch.repo <<EOF
[elasticsearch-6.x]
name=Elasticsearch repository for 6.x packages
baseurl=https://artifacts.elastic.co/packages/6.x/yum
gpgcheck=1
gpgkey=https://artifacts.elastic.co/GPG-KEY-elasticsearch
enabled=1
autorefresh=1
type=rpm-md
EOF
yum源
yum下载缓存包
yum install --downloadonl --downloaddir=/opt elasticsearch
yum install elasticsearch -y
3、安装elasticsearch的环境
echo "* soft nofile 65536" >> /etc/security/limits.conf
echo "* hard nofile 131072" >> /etc/security/limits.conf
echo "* soft nproc 4096" >> /etc/security/limits.conf
echo "* hard nproc 4096" >> /etc/security/limits.conf
echo "vm.max_map_count=655360" >> /etc/sysctl.conf

继续再修改一个参数
vim /etc/security/limits.d/90-nproc.conf
将里面的1024改为2048(ES最少要求为2048)
*          soft    nproc     2048
安装java环境(java环境必须是1.8版本以上的)
wget http://download.oracle.com/otn-pub/java/jdk/8u131-b11/d54c1d3a095b4ff2b6607d096fa80163/jdk-8u131-linux-x64.rpm
rpm -ivh jdk-8u131-linux-x64.rpm
也可以可以直接
yum install java -y
验证java安装成功
java -version
java version "1.8.0_131"
Java(TM) SE Runtime Environment (build 1.8.0_131-b11)
Java HotSpot(TM) 64-Bit Server VM (build 25.131-b11, mixed mode)

jdk环境配置
创建elasticsearch data的存放目录,并修改该目录的属主属组
# mkdir -p /data/es-data   (自定义用于存放data数据的目录)
# chown -R elasticsearch:elasticsearch /data/es-data
# mkdir -p /data/es-logs
# chown -R elasticsearch:elasticsearch /data/es-logs
修改elasticsearch的配置文件 vim /etc/elasticsearch/elasticsearch.yml
# 末尾添加
#找到配置文件中的cluster.name,打开该配置并设置集群名称
cluster.name: my-cluster-elk
#找到配置文件中的node.name,打开该配置并设置节点名称
node.name: elk-1
#修改data存放的路径
path.data: /data/es-data
#修改logs日志的路径
path.logs: /data/es-logs
#配置内存使用用交换分区,这虚拟机关闭实验成功
bootstrap.memory_lock: false    #
bootstrap.system_call_filter: false   ##限制程序使用某些系统调用
#允许任何来源IP
network.host: 0.0.0.0
#开启监听的端口
http.port: 9200
#增加新的参数,这样head插件可以访问es (5.x版本,如果没有可以自己手动加)
http.cors.enabled: true  #开启跨区域传送
http.cors.allow-origin: "*"  #跨区域允许的域名地址
启动服务
systemctl restart elasticsearch
systemctl enable elasticsearch

# 查看服务状态,如果有报错可以去看错误日志
vim /var/log/elasticsearch/demon.log  # (日志的名称是以集群名称命名的)
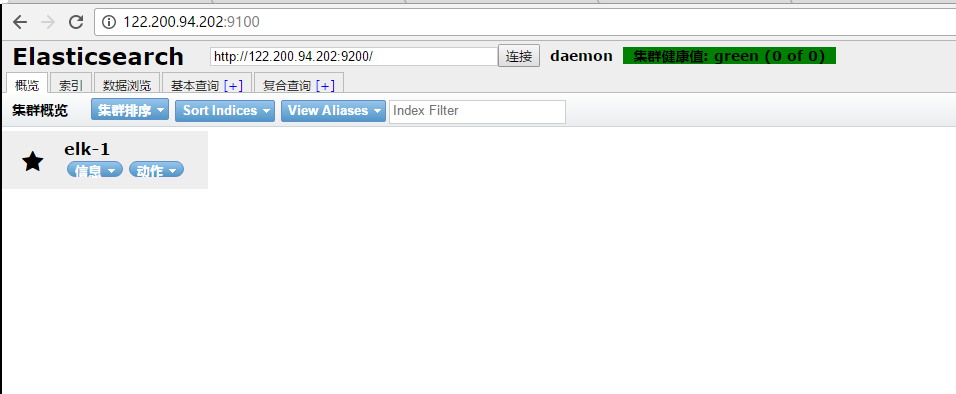
通过浏览器请求下9200的端口,看下是否成功
先检查9200端口是否起来
netstat -antp |grep 9200
tcp        0      0 :::9200                     :::*                        LISTEN      2934/java

浏览器访问测试是否正常(以下为正常)
# curl http://127.0.0.1:9200/
{
  "name" : "linux-node1",
  "cluster_name" : "demon",
  "cluster_uuid" : "kM0GMFrsQ8K_cl5Fn7BF-g",
  "version" : {
    "number" : "5.4.0",
    "build_hash" : "780f8c4",
    "build_date" : "2017-04-28T17:43:27.229Z",
    "build_snapshot" : false,
    "lucene_version" : "6.5.0"
  },
  "tagline" : "You Know, for Search"
}
4、如何和elasticsearch交互
JavaAPI

RESTful API
Javascript,.Net,PHP,Perl,Python

利用API查看状态
# curl -i -XGET 'localhost:9200/_count?pretty'
    HTTP/1.1 200 OK
    content-type: application/json; charset=UTF-8
    content-length: 95

    {
      "count" : 0,
      "_shards" : {
        "total" : 0,
        "successful" : 0,
        "failed" : 0
      }
    }
5、安装插件
安装elasticsearch-head插件

安装docker镜像或者通过github下载elasticsearch-head项目都是可以的,1或者2两种方式选择一种安装使用即可

1. 使用docker的集成好的elasticsearch-head
    # docker run -p 9100:9100 mobz/elasticsearch-head:5

    docker容器下载成功并启动以后,运行浏览器打开http://localhost:9100/

2. 使用git安装elasticsearch-head
    # yum install -y npm
    # git clone git://github.com/mobz/elasticsearch-head.git
    # cd elasticsearch-head
    # npm install
    # npm run start
    检查端口是否起来
    netstat -antp |grep 9100
    浏览器访问测试是否正常
    http://IP:9100/
2、LogStash的使用 使用filebeat这个不用
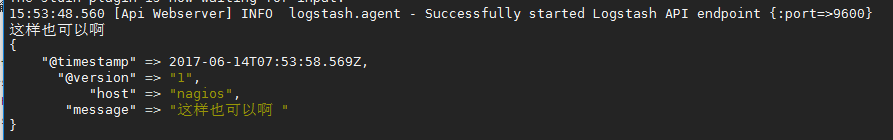
安装Logstash环境:

官方安装手册:
https://www.elastic.co/guide/en/logstash/current/installing-logstash.html

下载yum源的密钥认证:
# rpm --import https://artifacts.elastic.co/GPG-KEY-elasticsearch

利用yum安装logstash
# yum install -y logstash

查看下logstash的安装目录
# rpm -ql logstash

创建一个软连接,每次执行命令的时候不用在写安装路劲(默认安装在/usr/share下)
ln -s /usr/share/logstash/bin/logstash /bin/

执行logstash的命令
# logstash -e 'input { stdin { } } output { stdout {} }'

运行成功以后输入:
nihao

stdout返回的结果:
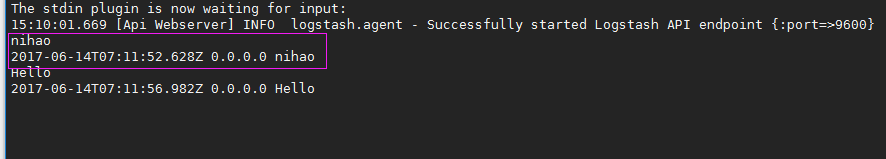
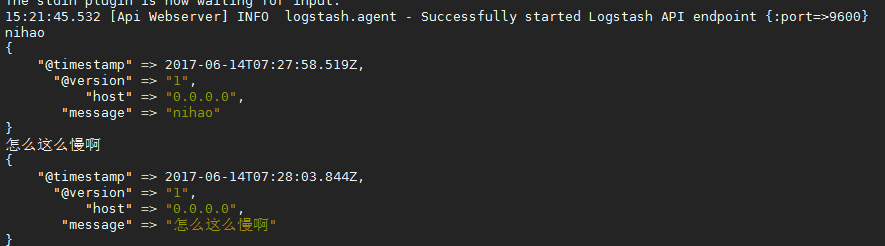
注:
   -e          执行操作
   input       标准输入
   { input }   插件
   output      标准输出
   { stdout }  插件  (输入信息)

通过rubydebug来输出下更详细的信息
# logstash -e 'input { stdin { } } output { stdout {codec => rubydebug} }'

执行成功输入:
nihao

stdout输出的结果:
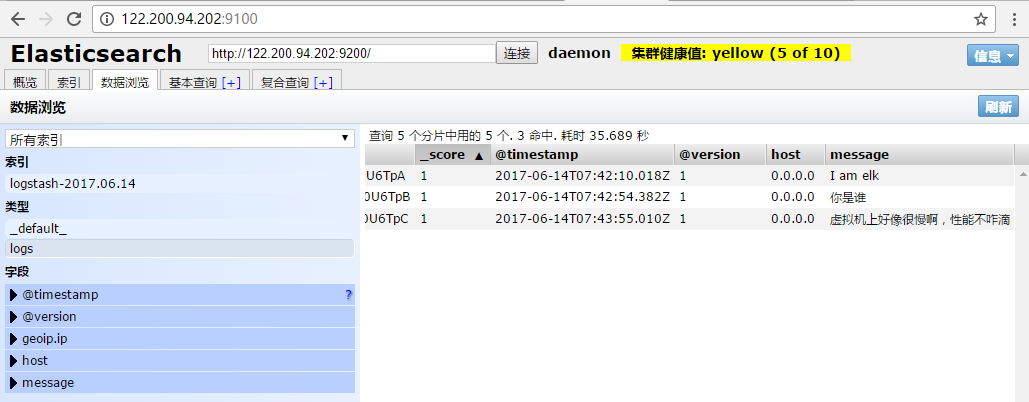
如果标准输出还有elasticsearch中都需要保留应该怎么玩,看下面
# /usr/share/logstash/bin/logstash -e 'input { stdin { } } output { elasticsearch { hosts => ["192.168.1.202:9200"] } stdout { codec => rubydebug }}'
运行成功以后输入:
I am elk
返回的结果(标准输出中的结果):
logstash使用配置文件说明
官方指南:
https://www.elastic.co/guide/en/logstash/current/configuration.html

创建配置文件01-logstash.conf
# vim /etc/logstash/conf.d/elk.conf

文件中添加以下内容
input { stdin { } }
output {
  elasticsearch { hosts => ["192.168.1.202:9200"] }
  stdout { codec => rubydebug }
}

使用配置文件运行logstash
# logstash -f ./elk.conf

运行成功以后输入以及标准输出结果
logstash的数据库类型
1. Input插件
    权威指南:https://www.elastic.co/guide/en/logstash/current/input-plugins.html

    file插件的使用
    # vim /etc/logstash/conf.d/elk.conf

    添加如下配置
    input {
        file {
            path => "/var/log/messages"
            type => "system"
            start_position => "beginning"
            }
    }
    output {
             elasticsearch {
                    hosts => ["192.168.1.202:9200"]
                    index => "system-%{+YYYY.MM.dd}"
                }
    }


运行logstash指定elk.conf配置文件,进行过滤匹配
#logstash -f /etc/logstash/conf.d/elk.conf

配置
来一发配置安全日志的并且把日志的索引按类型做存放,继续编辑elk.conf文件
# vim /etc/logstash/conf.d/elk.conf
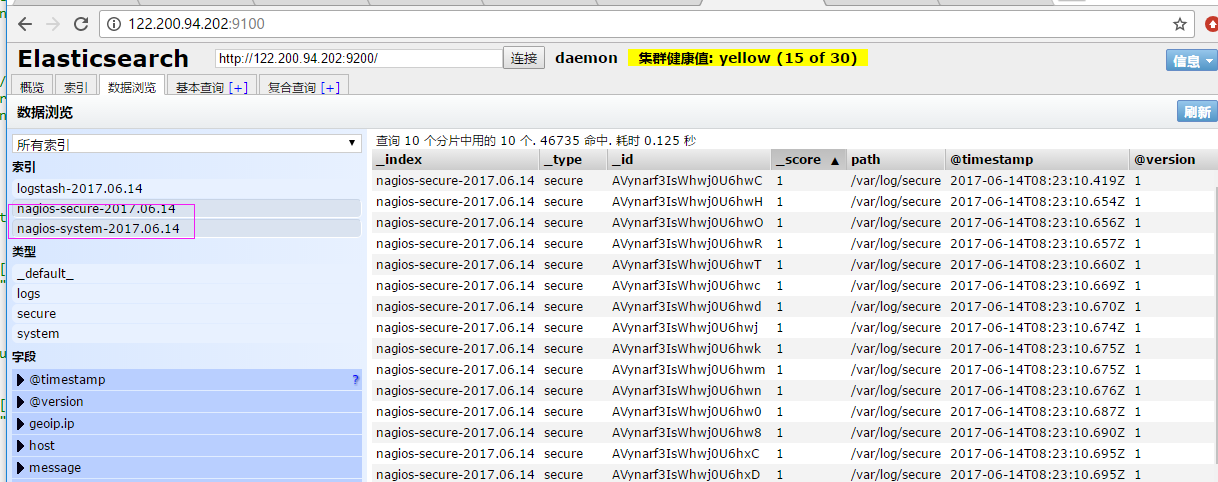
添加secure日志的路径
input {
    file {
        path => "/var/log/messages"
        type => "system"
        start_position => "beginning"
    }

    file {
        path => "/var/log/secure"
        type => "secure"
        start_position => "beginning"
    }
}

output {

    if [type] == "system" {

        elasticsearch {
            hosts => ["192.168.1.202:9200"]
            index => "nagios-system-%{+YYYY.MM.dd}"
        }
    }

    if [type] == "secure" {

        elasticsearch {
            hosts => ["192.168.1.202:9200"]
            index => "nagios-secure-%{+YYYY.MM.dd}"
        }
    }
}

运行logstash指定elk.conf配置文件,进行过滤匹配
cd /etc/logstash
# nohup logstash -f conf.d/elk.conf &

elk.conf
这些设置都没有问题之后,接下来安装下kibana,可以让在前台展示
2-2、logstash,优化输出格式参数。 使用filebeat这个不用
编辑nginx配置文件,修改以下内容(在http模块下添加)

log_format json '{"@timestamp":"$time_iso8601",'
             '"@version":"1",'
             '"client":"$remote_addr",'
             '"url":"$uri",'
             '"status":"$status",'
             '"domian":"$host",'
             '"host":"$server_addr",'
             '"size":"$body_bytes_sent",'
             '"responsetime":"$request_time",'
             '"referer":"$http_referer",'
             '"ua":"$http_user_agent"'
          '}';

修改access_log的输出格式为刚才定义的json
access_log  logs/elk.access.log  json;

继续修改apache的配置文件

LogFormat "{ \
        \"@timestamp\": \"%{%Y-%m-%dT%H:%M:%S%z}t\", \
        \"@version\": \"1\", \
        \"tags\":[\"apache\"], \
        \"message\": \"%h %l %u %t \\\"%r\\\" %>s %b\", \
        \"clientip\": \"%a\", \
        \"duration\": %D, \
        \"status\": %>s, \
        \"request\": \"%U%q\", \
        \"urlpath\": \"%U\", \
        \"urlquery\": \"%q\", \
        \"bytes\": %B, \
        \"method\": \"%m\", \
        \"site\": \"%{Host}i\", \
        \"referer\": \"%{Referer}i\", \
        \"useragent\": \"%{User-agent}i\" \
       }" ls_apache_json

一样修改输出格式为上面定义的json格式
CustomLog logs/access_log ls_apache_json
编辑logstash配置文件,进行日志收集
vim /etc/logstash/conf.d/elk-full.conf
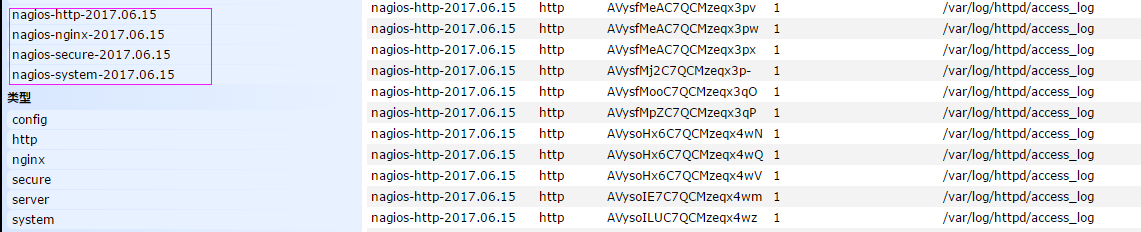
编辑logstash配置文件,进行日志收集
vim /etc/logstash/conf.d/full.conf

    input {
    file {
        path => "/var/log/messages"
        type => "system"
        start_position => "beginning"
    }

    file {
        path => "/var/log/secure"
        type => "secure"
        start_position => "beginning"
    }

    file {
        path => "/var/log/httpd/access_log"
        type => "http"
        start_position => "beginning"
    }

    file {
        path => "/var/log/nginx/ops_access.log"
        type => "nginx"
        start_position => "beginning"
    }

}

output {

    if [type] == "system" {

        elasticsearch {
            hosts => ["10.10.3.192:9200"]
            index => "nagios-system-%{+YYYY.MM.dd}"
        }
    }

    if [type] == "secure" {

        elasticsearch {
            hosts => ["10.10.3.192:9200"]
            index => "nagios-secure-%{+YYYY.MM.dd}"
        }
    }

    if [type] == "http" {

        elasticsearch {
            hosts => ["10.10.3.192:9200"]
            index => "nagios-http-%{+YYYY.MM.dd}"
        }
    }

    if [type] == "nginx" {

        elasticsearch {
            hosts => ["10.10.3.192:9200"]
            index => "nagios-nginx-%{+YYYY.MM.dd}"
        }
    }

}

运行看看效果如何
logstash -f /etc/logstash/conf.d/full.conf
可以发现所有创建日志的索引都已存在,接下来就去Kibana创建日志索引,进行展示(按照上面的方法进行创建索引即可),看下展示的效果
接下来再来一发MySQL慢日志的展示
由于MySQL的慢日志查询格式比较特殊,所以需要用正则进行匹配,并使用multiline能够进行多行匹配(看具体配置)
input {
    file {
        path => "/var/log/messages"
        type => "system"
        start_position => "beginning"
    }

    file {
        path => "/var/log/secure"
        type => "secure"
        start_position => "beginning"
    }

    file {
        path => "/var/log/httpd/access_log"
        type => "http"
        start_position => "beginning"
    }

    file {
        path => "/var/log/nginx/ops_access.log"
        type => "nginx"
        start_position => "beginning"
    }

    file {
        path => "/var/log/mysql/mysql.slow.log"
        type => "mysql"
        start_position => "beginning"
    codec => multiline {
            pattern => "^# User@Host:"
            negate => true
            what => "previous"
        }
    }
}

filter {

    grok {
        match => { "message" => "SELECT SLEEP" }
            add_tag => [ "sleep_drop" ]
            tag_on_failure => []
    }


    if "sleep_drop" in [tags] {
            drop {}
    }

    grok {
        match => { "message" => "(?m)^# User@Host: %{USER:User}\[[^\]]+\] @ (?:(?<clienthost>\S*) )?\[(?:%{IP:Client_IP})?\]\s.*# Query_time: %{NUMBER:Query_Time:float}\s+Lock_time: %{NUMBER:Lock_Time:float}\s+Rows_sent: %{NUMBER:Rows_Sent:int}\s+Rows_examined: %{NUMBER:Rows_Examined:int}\s*(?:use %{DATA:Database};\s*)?SET timestamp=%{NUMBER:timestamp};\s*(?<Query>(?<Action>\w+)\s+.*)\n# Time:.*$" }
        }

     date {
            match => [ "timestamp", "UNIX" ]
            remove_field => [ "timestamp" ]
    }


}


output {

    if [type] == "system" {

        elasticsearch {
            hosts => ["10.10.3.192:9200"]
            index => "nagios-system-%{+YYYY.MM.dd}"
        }
    }

    if [type] == "secure" {

        elasticsearch {
            hosts => ["10.10.3.192:9200"]
            index => "nagios-secure-%{+YYYY.MM.dd}"
        }
    }

    if [type] == "http" {

        elasticsearch {
            hosts => ["10.10.3.192:9200"]
            index => "nagios-http-%{+YYYY.MM.dd}"
        }
    }

    if [type] == "nginx" {

        elasticsearch {
            hosts => ["192.168.1.202:9200"]
            index => "nagios-nginx-%{+YYYY.MM.dd}"
        }
    }

    if [type] == "mysql" {

        elasticsearch {
            hosts => ["192.168.1.202:9200"]
            index => "nagios-mysql-slow-%{+YYYY.MM.dd}"
        }
    }
}
查看效果(一条慢日志查询会显示一条,如果不进行正则匹配,那么一行就会显示一条)
体的日志输出需求,进行具体的分析
3、Kibana的安装及使用
# 安装kibana环境
官方安装手册:https://www.elastic.co/guide/en/kibana/current/install.html
下载kibana的tar.gz的软件包
# wget https://artifacts.elastic.co/downloads/kibana/kibana-5.4.0-linux-x86_64.tar.gz
# 解压kibana的tar包
tar -xzf kibana-5.4.0-linux-x86_64.tar.gz
进入解压好的kibana
mv kibana-5.4.0-linux-x86_64 /usr/local
# 创建kibana的软连接
ln -s /usr/local/kibana-5.4.0-linux-x86_64/ /usr/local/kibana

# 安装
yum install kibana -y
systemctl restart kibana
systemctl enable filebeat


# 编辑kibana的配置文件
vim /usr/local/kibana/config/kibana.yml

修改配置文件如下,开启以下的配置
server.port: 5601
server.host: "0.0.0.0"
elasticsearch.url: "http://192.168.1.202:9200"
kibana.index: ".kibana"


# 安装screen,以便于kibana在后台运行(当然也可以不用安装,用其他方式进行后台启动)
yum -y install screen
screen
/usr/local/kibana/bin/kibana
netstat -antp |grep 5601
tcp        0      0 0.0.0.0:5601                0.0.0.0:*                   LISTEN      17007/node


打开浏览器并设置对应的index
http://IP:5601

kibana安装配置
ps: 如果访问 Kibana server is not ready yet
Kibana server is not ready yet
4、filebeat使用
使用filebeat这个不用
vim /etc/logstash/conf.d/elk.conf
input {
    stdin {}
    beats {
        port => 5044
    }
}
output {
    elasticsearch {
        hosts => ["192.168.126.128:9200"]
    }
    stdout {
        codec => rubydebug
    }
}
port是接受filebeat的端口,192.168.126.128:9200为elsticsearch的的服务地址,这儿要替换成你的地址。
启动 logstash -f conf.d/elk.conf &
查看进程,监听端口
ps -ef|grep logstash
netstat -lntp|grep 5044
安装Filebeat
rpm -ivh filebeat-6.8.13-x86_64.rpm
yum install filebeat -y
主要开启
enabled: true
paths:
- /var/log/yum.log
vim /etc/filebeat/filebeat.yml
###################### Filebeat Configuration Example #########################

# This file is an example configuration file highlighting only the most common
# options. The filebeat.reference.yml file from the same directory contains all the
# supported options with more comments. You can use it as a reference.
#
# You can find the full configuration reference here:
# https://www.elastic.co/guide/en/beats/filebeat/index.html

# For more available modules and options, please see the filebeat.reference.yml sample
# configuration file.

#=========================== Filebeat inputs =============================

filebeat.inputs:

# Each - is an input. Most options can be set at the input level, so
# you can use different inputs for various configurations.
# Below are the input specific configurations.

- type: log

  # Change to true to enable this input configuration.
  enabled: true

  # Paths that should be crawled and fetched. Glob based paths.
  paths:
    # - /var/log/*.log
    - /data/logs/admin.log
    - /data/logs/mobile.log
    - /data/logs/aaa.log
    #- c:\programdata\elasticsearch\logs\*

  # Exclude lines. A list of regular expressions to match. It drops the lines that are
  # matching any regular expression from the list.
  exclude_lines: ['^DBG']

  # Include lines. A list of regular expressions to match. It exports the lines that are
  # matching any regular expression from the list.
  #include_lines: ['^ERR', '^WARN']

  # Exclude files. A list of regular expressions to match. Filebeat drops the files that
  # are matching any regular expression from the list. By default, no files are dropped.
  #exclude_files: ['.gz$']

  # Optional additional fields. These fields can be freely picked
  # to add additional information to the crawled log files for filtering
  #fields:
  #  level: debug
  #  review: 1

  ### Multiline options

  # Multiline can be used for log messages spanning multiple lines. This is common
  # for Java Stack Traces or C-Line Continuation

  # The regexp Pattern that has to be matched. The example pattern matches all lines starting with [
  multiline.pattern: ^\[

  # Defines if the pattern set under pattern should be negated or not. Default is false.
  multiline.negate: true

  # Match can be set to "after" or "before". It is used to define if lines should be append to a pattern
  # that was (not) matched before or after or as long as a pattern is not matched based on negate.
  # Note: After is the equivalent to previous and before is the equivalent to to next in Logstash
  multiline.match: after


#============================= Filebeat modules ===============================
filebeat.config.modules:
  # Glob pattern for configuration loading
  path: ${path.config}/modules.d/*.yml

  # Set to true to enable config reloading
  reload.enabled: false

  # Period on which files under path should be checked for changes
  #reload.period: 10s

#==================== Elasticsearch template setting ==========================

setup.template.settings:
  index.number_of_shards: 3
  #index.codec: best_compression
  #_source.enabled: false

#================================ General =====================================

# The name of the shipper that publishes the network data. It can be used to group
# all the transactions sent by a single shipper in the web interface.
#name:

# The tags of the shipper are included in their own field with each
# transaction published.
#tags: ["service-X", "web-tier"]

# Optional fields that you can specify to add additional information to the
# output.
#fields:
#  env: staging
fields:
 log_source: node1
 logtype: applog


#============================== Dashboards =====================================
# These settings control loading the sample dashboards to the Kibana index. Loading
# the dashboards is disabled by default and can be enabled either by setting the
# options here, or by using the `-setup` CLI flag or the `setup` command.
#setup.dashboards.enabled: false

# The URL from where to download the dashboards archive. By default this URL
# has a value which is computed based on the Beat name and version. For released
# versions, this URL points to the dashboard archive on the artifacts.elastic.co
# website.
#setup.dashboards.url:

#============================== Kibana =====================================

# Starting with Beats version 6.0.0, the dashboards are loaded via the Kibana API.
# This requires a Kibana endpoint configuration.
setup.kibana:

  # Kibana Host
  # Scheme and port can be left out and will be set to the default (http and 5601)
  # In case you specify and additional path, the scheme is required: http://localhost:5601/path
  # IPv6 addresses should always be defined as: https://[2001:db8::1]:5601
  #host: "localhost:5601"

  # Kibana Space ID
  # ID of the Kibana Space into which the dashboards should be loaded. By default,
  # the Default Space will be used.
  #space.id:

#============================= Elastic Cloud ==================================

# These settings simplify using filebeat with the Elastic Cloud (https://cloud.elastic.co/).

# The cloud.id setting overwrites the `output.elasticsearch.hosts` and
# `setup.kibana.host` options.
# You can find the `cloud.id` in the Elastic Cloud web UI.
#cloud.id:

# The cloud.auth setting overwrites the `output.elasticsearch.username` and
# `output.elasticsearch.password` settings. The format is `<user>:<pass>`.
#cloud.auth:

#================================ Outputs =====================================

# Configure what output to use when sending the data collected by the beat.

#-------------------------- Elasticsearch output ------------------------------
output.elasticsearch:
  # Array of hosts to connect to.
  hosts: ["192.168.126.128:9200"]

  # Enabled ilm (beta) to use index lifecycle management instead daily indices.
  #ilm.enabled: false

  # Optional protocol and basic auth credentials.
  #protocol: "https"
  #username: "elastic"
  #password: "changeme"

#----------------------------- Logstash output --------------------------------
#output.logstash:
  # The Logstash hosts
  #hosts: ["localhost:5044"]

  # Optional SSL. By default is off.
  # List of root certificates for HTTPS server verifications
  #ssl.certificate_authorities: ["/etc/pki/root/ca.pem"]

  # Certificate for SSL client authentication
  #ssl.certificate: "/etc/pki/client/cert.pem"

  # Client Certificate Key
  #ssl.key: "/etc/pki/client/cert.key"

#================================ Processors =====================================

# Configure processors to enhance or manipulate events generated by the beat.

processors:
  - add_host_metadata: ~
  - add_cloud_metadata: ~

#================================ Logging =====================================

# Sets log level. The default log level is info.
# Available log levels are: error, warning, info, debug
#logging.level: debug

# At debug level, you can selectively enable logging only for some components.
# To enable all selectors use ["*"]. Examples of other selectors are "beat",
# "publish", "service".
#logging.selectors: ["*"]

#============================== Xpack Monitoring ===============================
# filebeat can export internal metrics to a central Elasticsearch monitoring
# cluster.  This requires xpack monitoring to be enabled in Elasticsearch.  The
# reporting is disabled by default.

# Set to true to enable the monitoring reporter.
#xpack.monitoring.enabled: false

# Uncomment to send the metrics to Elasticsearch. Most settings from the
# Elasticsearch output are accepted here as well. Any setting that is not set is
# automatically inherited from the Elasticsearch output configuration, so if you
# have the Elasticsearch output configured, you can simply uncomment the
# following line.
#xpack.monitoring.elasticsearch:
启动 nohup filebeat -e -c filebeat.yml &
systemctl restart filebeat
systemctl enable filebeat
Filebeat.yml 配置的主要有两个部分,一个是日志收集,一个是日志输出的配置。关闭配置中开启的elasticserach中配置
配置解释:
type: log 读取日志文件的每一行(默认)
enabled: true 该配置是否生效,如果改为false,将不收集该配置的日志
paths: 要抓取日志的全路径
fields: 自定义属性,可以定义多个,继续往下排就行
multiline.pattern: 正则表达式
multiline.negate: true 或 false;默认是false,匹配pattern的行合并到上一行;true,不匹配pattern的行合并到上一行
multiline.match: after 或 before,合并到上一行的末尾或开头

exclude_lines: ['DEBUG'] 该属性配置不收集DEBUG级别的日志,如果配置多行 这个配置也要放在多行的后面

192.168.126.128:5044 为输出到Logstash的地址和端口。


验证:
admin.log mobile.log写入数据
在kibana创建索引,就可以查看日志了
ps:filebet直接把日志写到elasticsearch中
ELK,reidis消息队列存储篇
安装reids
# yum install -y redis

修改redis的配置文件
# vim /etc/redis.conf

修改内容如下
daemonize yes

bind 10.10.3.192

启动redis服务
# /etc/init.d/redis restart

测试redis的是否启用成功
# redis-cli -h 10.10.3.192

输入info如果有不报错即可
redis 192.168.1.202:6379> info

redis_version:2.4.10
....
1、把标准输出的数据存储到redis库中,编辑配置redis-out.conf配置文件 # vim /etc/logstash/conf.d/redis-out.conf
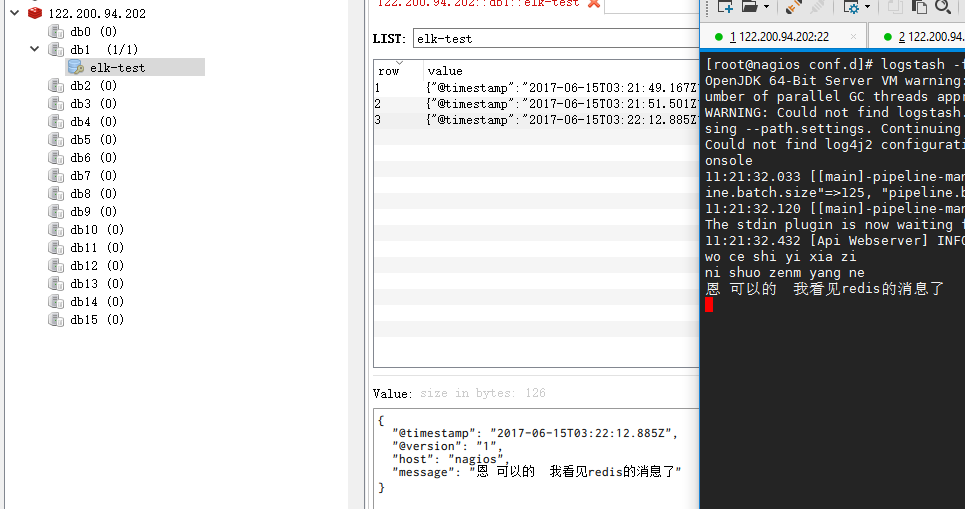
input {
            stdin {}
}

output {

        redis {
                host => "10.10.3.192"
                port => "6379"
                password => 'test'
                db => '1'
                data_type => "list"
                key => 'elk-test'
        }
}


运行logstash指定redis-out.conf的配置文件
# /usr/share/logstash/bin/logstash -f /etc/logstash/conf.d/redis-out.conf
运行成功以后,在logstash中输入内容(查看下效果)
没有客户端可以命令

2、把reids的存储的数据输入到elasticsearch中
编辑配置redis-in.conf配置文件,把reids的存储的数据输出到elasticsearch中
# vim /etc/logstash/conf.d/redis-in.conf

添加如下内容
input{
    redis {
                    host => "10.10.3.192"
                    port => "6379"
                    password => 'test'
                    db => '1'
                    data_type => "list"
                    key => 'elk-test'
                    batch_count => 1 #这个值是指从队列中读取数据时,一次性取出多少条,默认125条(如果redis中没有125条,就会报错,所以在测试期间加上这个值)
            }

}

output {
        elasticsearch {
                hosts => ['10.10.3.192:9200']
                index => 'redis-test-%{+YYYY.MM.dd}'
        }
}
运行logstash指定redis-in.conf的配置文件
# /usr/share/logstash/bin/logstash -f /etc/logstash/conf.d/redis-in.conf
3、把之前的配置文件修改一下,变成所有的 日志监控的来源文件都存 输出到redis中,然后通过redis在 输入到elasticsearch中
输出到 redis
把之前的配置文件修改一下,变成所有的日志监控的来源文件都存放到redis中,然后通过redis在输出到elasticsearch中

更改为如下,编辑full.conf
input {
    file {
            path => "/var/log/httpd/access_log"
            type => "http"
            start_position => "beginning"
    }

    file {
            path => "/var/log/nginx/ops_access.log"
            type => "nginx"
            start_position => "beginning"
    }

    file {
            path => "/var/log/secure"
            type => "secure"
            start_position => "beginning"
    }

    file {
            path => "/var/log/messages"
            type => "system"
            start_position => "beginning"
    }
}


output {
    if [type] == "http" {
        redis {
            host => "10.10.3.192"
            password => 'test'
            port => "6379"
            db => "6"
            data_type => "list"
            key => 'nagios_http'
        }
    }

    if [type] == "nginx" {
        redis {
            host => "10.10.3.192"
            password => 'test'
            port => "6379"
            db => "6"
            data_type => "list"
            key => 'nagios_nginx'
        }
    }

    if [type] == "secure" {
        redis {
            host => "10.10.3.192"
            password => 'test'
            port => "6379"
            db => "6"
            data_type => "list"
            key => 'nagios_secure'
        }
    }

    if [type] == "system" {
        redis {
            host => "10.10.3.192"
            password => 'test'
            port => "6379"
            db => "6"
            data_type => "list"
            key => 'nagios_system'
        }
    }
}


运行logstash指定shipper.conf的配置文件
# /usr/share/logstash/bin/logstash -f /etc/logstash/conf.d/full.conf
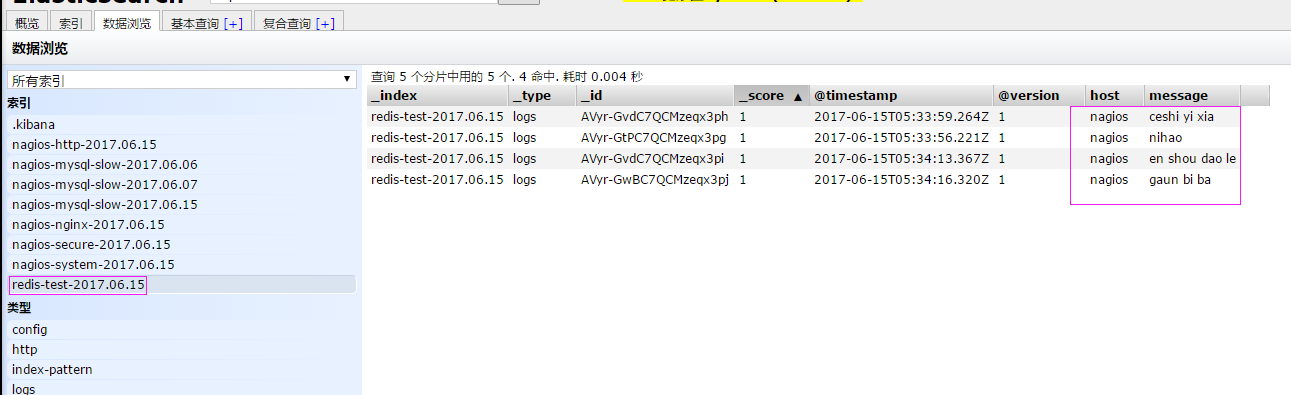
在redis中查看是否已经将数据写到里面(有时候输入的日志文件不产生日志,会导致redis里面也没有写入日志
输入到 elasticsearch
把redis中的数据读取出来,写入到elasticsearch中(需要另外一台主机做实验,这里测试用同一台也可以)
编辑配置文件
# vim /etc/logstash/conf.d/redis-in-all.conf
input {
    redis {
        type => "system"
        host => "10.10.3.192"
        password => 'test'
        port => "6379"
        db => "6"
        data_type => "list"
        key => 'nagios_system'
    batch_count => 1
     }

    redis {
        type => "http"
        host => "10.10.3.192"
        password => 'test'
        port => "6379"
        db => "6"
        data_type => "list"
        key => 'nagios_http'
    batch_count => 1
     }

    redis {
        type => "nginx"
        host => "10.10.3.192"
        password => 'test'
        port => "6379"
        db => "6"
        data_type => "list"
        key => 'nagios_nginx'
    batch_count => 1
     }

    redis {
        type => "secure"
        host => "10.10.3.192"
        password => 'test'
        port => "6379"
        db => "6"
        data_type => "list"
        key => 'nagios_secure'
    batch_count => 1
    }
}

output {

    if [type] == "system" {
        elasticsearch {
            hosts => ["10.10.3.192:9200"]
            index => "nagios-system-%{+YYYY.MM.dd}"
        }
    }

    if [type] == "http" {
        elasticsearch {
            hosts => ["10.10.3.192:9200"]
            index => "nagios-http-%{+YYYY.MM.dd}"
        }
    }

    if [type] == "nginx" {
        elasticsearch {
            hosts => ["10.10.3.192:9200"]
            index => "nagios-nginx-%{+YYYY.MM.dd}"
        }
    }

    if [type] == "secure" {
        elasticsearch {
            hosts => ["10.10.3.192:9200"]
            index => "nagios-secure-%{+YYYY.MM.dd}"
        }
    }
}
注意:
input是从客户端收集的
output是同样也保存到10.10.3.192中的elasticsearch中,如果要保存到当前的主机上,可以把output中的hosts修改成localhost,如果还需要在kibana中显示,需要在本机上部署kabana,为何要这样做,起到一个松耦合的目的
说白了,就是在客户端收集日志,写到服务端的redis里或是本地的redis里面,输出的时候对接ES服务器即可

运行命令看看效果
# /usr/share/logstash/bin/logstash -f /etc/logstash/conf.d/redis-out.conf
效果是和直接往ES服务器输出一样的(这样是先将日志存到redis数据库,然后再从redis数据库里取出日志)
上线ELK
1. 日志分类
        系统日志        rsyslog     logstash    syslog插件
        访问日志        nginx       logstash    codec   json
        错误日志        file        logstash    mulitline
        运行日志        file        logstash    codec   json
        设备日志        syslog      logstash    syslog插件
        Debug日志      file         logstash   json 或者 mulitline

2.  日志标准化
        路径      固定
        格式      尽量json

3.   系统个日志开始-->错误日志-->运行日志-->访问日志
因为ES保存日志是永久保存,所以需要定期删除一下日志,下面命令为删除指定时间前的日志
curl -X DELETE http://xx.xx.com:9200/logstash-*-`date +%Y-%m-%d -d "-$n days"`
curl -XDELETE 'http://192.168.10.181:9200/*-2019.4*
end...
查看服务状态,如果有报错可以去看错误日志
vim /var/log/elasticsearch/demon.log  (日志的名称是以集群名称命名的)
创建开机自启动服务 # chkconfig elasticsearch on
本文来自博客园,作者:王竹笙,转载请注明原文链接:https://www.cnblogs.com/edeny/p/10796651.html

 浙公网安备 33010602011771号