

JMH
java微基准测试JMH引入报错RuntimeException: ERROR: Unable to find the resource: /META-INF/BenchmarkList
<dependency>
    <groupId>org.openjdk.jmh</groupId>
    <artifactId>jmh-core</artifactId>
    <version>1.21</version>
</dependency>
<dependency>
    <groupId>org.openjdk.jmh</groupId>
    <artifactId>jmh-generator-annprocess</artifactId>
    <version>1.21</version>
    <scope>provided</scope>
</dependency>
这里一定我注意,我解决的办法是上面的标红的scope 标签是provided 之前我填写的test一直报错!
provided,compile 都是可以的,但是这个包我们在生产中并不需要,一般写provided
scope为test表示依赖项目仅仅参与测试相关的工作,包括测试代码的编译,执行
2、eclipse上还报上述错误
eclipse需要安装apt插件,从eclipse marketplace上搜索apt,找到m2e-apt x.x.x 安装它。
maven启用apt
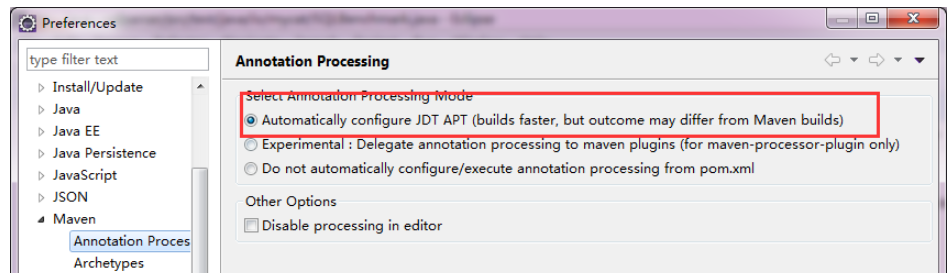
二、IDEA
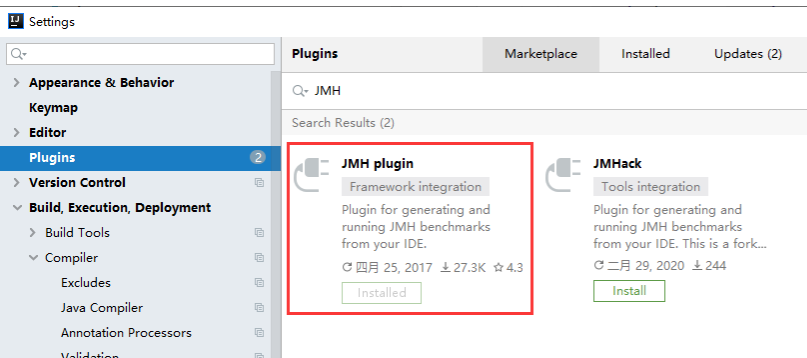
2.1、idea安装JMH插件JMH plugin
File->Settings->Plugins->JMH plugin
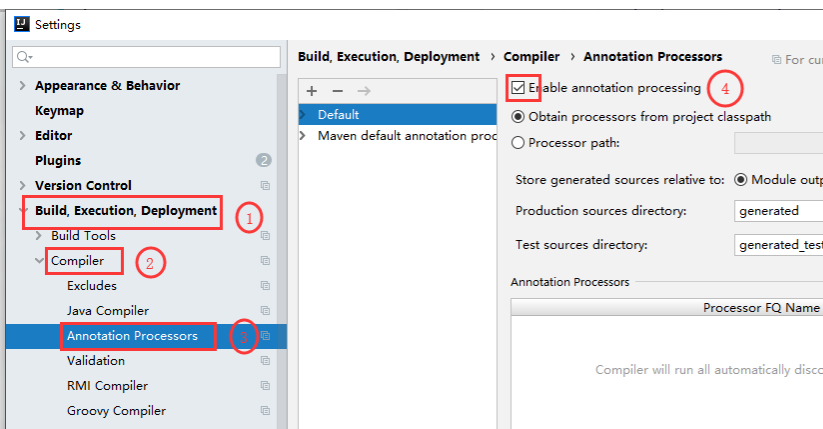
2.2、打开运行程序注解配置
因为JMH在运行的时候他用到了注解,注解这个东西你自己得写一个程序得解释他,所以你要把这个给设置上允许JMH能够对注解进行处理:
Compiler -> Annotation Processors -> Enable Annotation Processing(打钩)
2.3、运行测试类,如果遇到下面的错误:
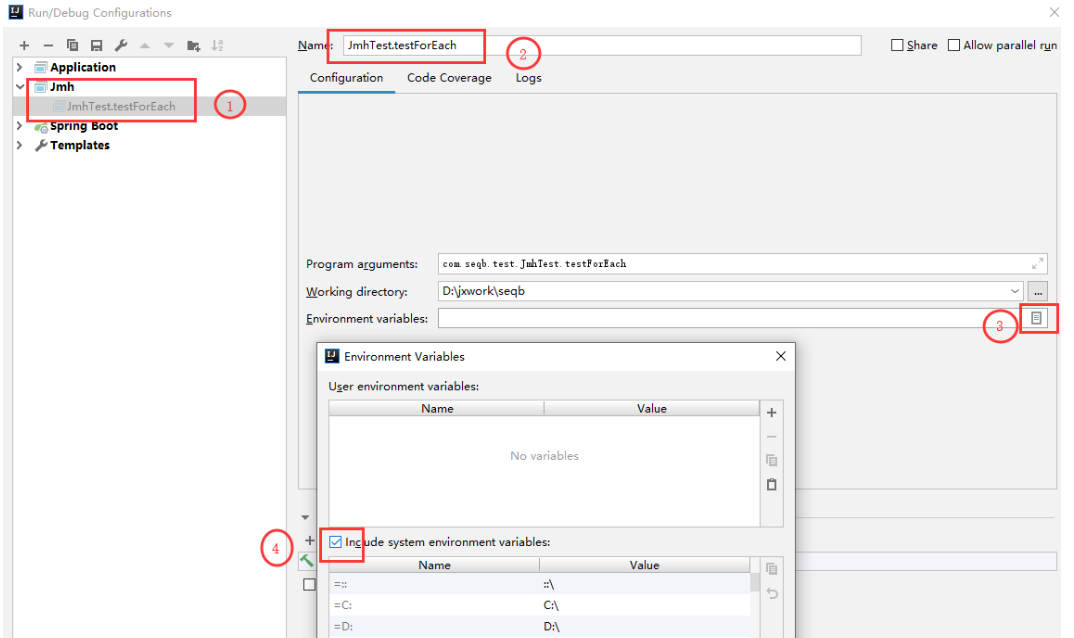
ERROR: org.openjdk.jmh.runner.RunnerException: ERROR: Exception while trying to acquire the JMH lock (C:\WINDOWS/jmh.lock): 拒绝访问。, exiting. Use -Djmh.ignoreLock=true to forcefully continue.
at org.openjdk.jmh.runner.Runner.run(Runner.java:216)
at org.openjdk.jmh.Main.main(Main.java:71)
这个错误是因为JMH运行需要访问系统的TMP目录,解决办法是:
打开Run Configuration -> Environment Variables -> include system environment viables(勾选)
2.4、开始第一个简单的JMH程序
1、直接通过maven的命令,通过maven archetype生成jmh项目
2、然后在项目中编写需要进行微测的方法(可以指定检测输出,循环几次,以及测试数据)
3、maven clean install 打包,然后运行benchmark.jar
第一步:生成JMH项目
mvn archetype:generate -DinteractiveMode=false -DarchetypeGroupId=org.openjdk.jmh -DarchetypeArtifactId=jmh-java-benchmark-archetype -DarchetypeVersion=1.25 -DgroupId=com.dxz -DartifactId=benchmark-demo -Dversion=1.0
执行完成后,在window资源管理器可以看到benchmark-demo项目生成好了:

第二步,在项目中编写自己需要测试的类
使用maven提供的默认类作为参考编写,先不用纠结注解的具体使用
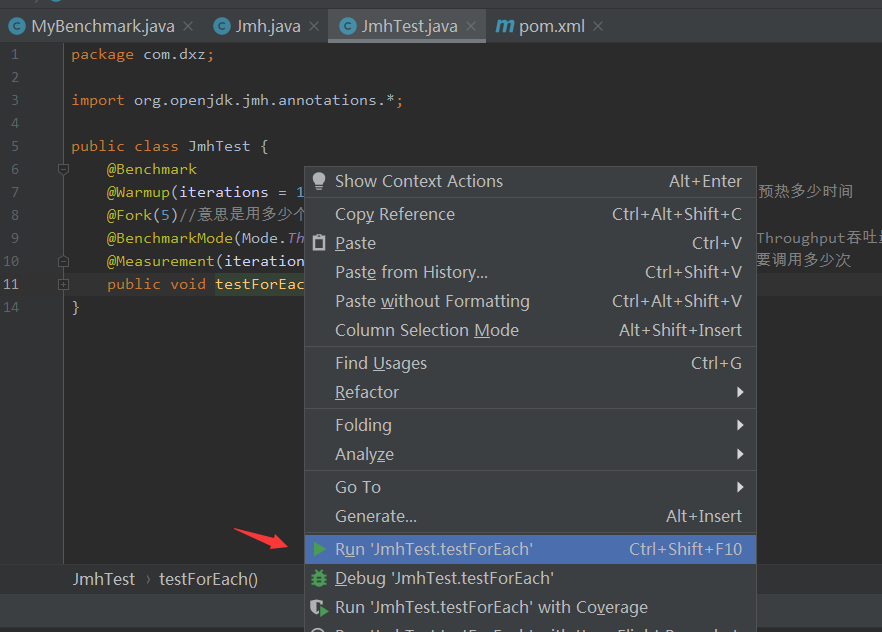
package com.dxz;

import java.util.ArrayList;
import java.util.List;
import java.util.Random;

public class Jmh {

    static List<Integer> nums = new ArrayList<>();

    static {
        Random r = new Random();
        for (int i = 0; i < 10000; i++) {
            nums.add(1000000 + r.nextInt(1000000));
        }
    }

    public static void foreach() {
        nums.forEach(v -> isPrime(v));
    }

    static void parallel() {
        nums.parallelStream().forEach(Jmh::isPrime);
    }

    static boolean isPrime(int num) {
        for (int i = 2; i <= num / 2; i++) {
            if (num % i == 0) return false;
        }
        return true;
    }
}

package com.dxz;

import org.openjdk.jmh.annotations.*;

public class JmhTest {
    @Benchmark
    @Warmup(iterations = 1, time = 3)//在专业测试里面首先要进行预热,预热多少次,预热多少时间
    @Fork(5)//意思是用多少个线程去执行我们的程序
    @BenchmarkMode(Mode.Throughput)//是对基准测试的一个模式,这个模式用的最多的是Throughput吞吐量
    @Measurement(iterations = 1, time = 3)//是整个测试要测试多少遍,调用这个方法要调用多少次
    public void testForEach() {
        Jmh.foreach();
    }
}
第三步,运行
结果:
C:\java\jdk1.8.0_111\bin\java.exe -Dfile.encoding=UTF-8 -classpath D:\study\jmh\benchmark-demo\target\classes;C:\Users\4cv748wpd3\.m2\repository\org\openjdk\jmh\jmh-core\1.25\jmh-core-1.25.jar;C:\Users\4cv748wpd3\.m2\repository\net\sf\jopt-simple\jopt-simple\4.6\jopt-simple-4.6.jar;C:\Users\4cv748wpd3\.m2\repository\org\apache\commons\commons-math3\3.2\commons-math3-3.2.jar org.openjdk.jmh.Main com.dxz.JmhTest.testForEach
# JMH version: 1.25
# VM version: JDK 1.8.0_111, Java HotSpot(TM) 64-Bit Server VM, 25.111-b14
# VM invoker: C:\java\jdk1.8.0_111\jre\bin\java.exe
# VM options: -Dfile.encoding=UTF-8
# Warmup: 1 iterations, 3 s each
# Measurement: 1 iterations, 3 s each
# Timeout: 10 min per iteration
# Threads: 1 thread, will synchronize iterations
# Benchmark mode: Throughput, ops/time
# Benchmark: com.dxz.JmhTest.testForEach

# Run progress: 0.00% complete, ETA 00:00:30
# Fork: 1 of 5
# Warmup Iteration   1: 0.594 ops/s
Iteration   1: 0.646 ops/s

# Run progress: 20.00% complete, ETA 00:00:29
# Fork: 2 of 5
# Warmup Iteration   1: 0.626 ops/s
Iteration   1: 0.620 ops/s

# Run progress: 40.00% complete, ETA 00:00:21
# Fork: 3 of 5
# Warmup Iteration   1: 0.642 ops/s
Iteration   1: 0.639 ops/s

# Run progress: 60.00% complete, ETA 00:00:14
# Fork: 4 of 5
# Warmup Iteration   1: 0.628 ops/s
Iteration   1: 0.637 ops/s

# Run progress: 80.00% complete, ETA 00:00:07
# Fork: 5 of 5
# Warmup Iteration   1: 0.652 ops/s
Iteration   1: 0.647 ops/s


Result "com.dxz.JmhTest.testForEach":
  0.638 ±(99.9%) 0.041 ops/s [Average]
  (min, avg, max) = (0.620, 0.638, 0.647), stdev = 0.011
  CI (99.9%): [0.597, 0.679] (assumes normal distribution)


# Run complete. Total time: 00:00:34

REMEMBER: The numbers below are just data. To gain reusable insights, you need to follow up on
why the numbers are the way they are. Use profilers (see -prof, -lprof), design factorial
experiments, perform baseline and negative tests that provide experimental control, make sure
the benchmarking environment is safe on JVM/OS/HW level, ask for reviews from the domain experts.
Do not assume the numbers tell you what you want them to tell.

Benchmark             Mode  Cnt  Score   Error  Units
JmhTest.testForEach  thrpt    5  0.638 ± 0.041  ops/s

Process finished with exit code 0
参考:
https://blog.csdn.net/mwqyykl/article/details/109367115
https://blog.csdn.net/qq_24101357/article/details/106000626

 浙公网安备 33010602011771号