


1)简介:
DESeq2-package: for differential analysis of count data(对count data 做差异分析)
2)安装
if("DESeq2" %in% rownames(installed.packages()) == FALSE) {source("http://bioconductor.org/biocLite.R");biocLite("DESeq2")}
suppressMessages(library(DESeq2))
ls('package:DESeq2')
3)对象的使用说明
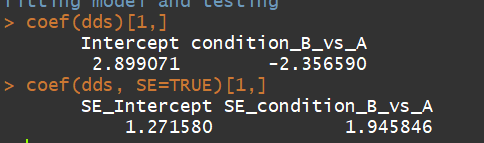
3.1)coef(Extract a matrix of model coefficients/standard errors,高级用户检验模型系数)
语法:coef(object, SE = FALSE, ...)
参数解释:
object:a DESeqDataSet returned by DESeq, nbinomWaldTest, or nbinomLRT.
例子:
dds <- makeExampleDESeqDataSet(m=4)
dds <- DESeq(dds)
coef(dds)[1,]
coef(dds, SE=TRUE)[1,]
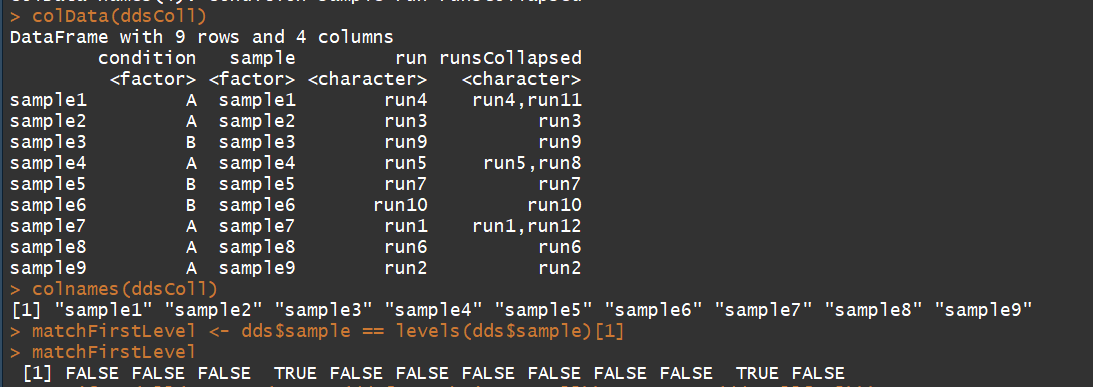
3.2) collapseReplicates:Collapse technical replicates in a RangedSummarizedExperiment or DESeqDataSet(用于消除技术重复)
用法:collapseReplicates(object, groupby, run, renameCols = TRUE)
参数:
object:A RangedSummarizedExperiment or DESeqDataSet
groupby:a grouping factor, as long as the columns of object,分组因子
run:optional, the names of each unique column in object. if provided, a new column runsCollapsed will be added to the colData which pastes together the names of run (测序run)
renameCols:whether to rename the columns of the returned object using the levels of the grouping factor
例子:
dds <- makeExampleDESeqDataSet(m=12)
str(dds)
dds$sample <- factor(sample(paste0("sample",rep(1:9, c(2,1,1,2,1,1,2,1,1))))) (#共9个样品:其中 3个样品有2个技术重重)
dds$run <- paste0("run",1:12) #12个run道
ddsColl <- collapseReplicates(dds, dds$sample, dds$run)
# examine the colData and column names of the collapsed data
colData(ddsColl)
colnames(ddsColl)
# check that the sum of the counts for "sample1" is the same
# as the counts in the "sample1" column in ddsColl
matchFirstLevel <- dds$sample == levels(dds$sample)[1]
stopifnot(all(rowSums(counts(dds[,matchFirstLevel])) == counts(ddsColl[,1])))
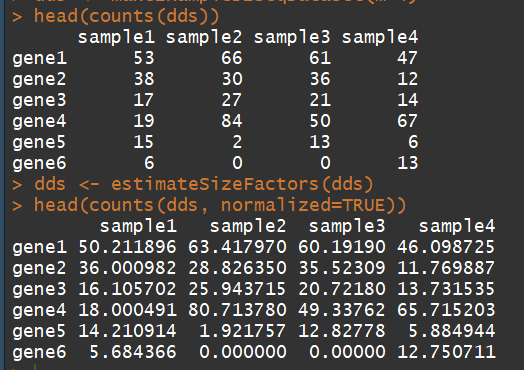
3.3)counts:Accessors for the ’counts’ slot of a DESeqDataSet object(对表达矩阵进行统计,)
one row for each observational unit (gene or the like), and one column for each sample(行代表观察值(例如基因),列代表样本(例如肝、脾、肾等))
语法:counts(object, normalized = FALSE,replaced = FALSE)
参数:
object:a DESeqDataSet object(表达矩阵).
normalized:logical indicating whether or not to divide the counts by the size factors or normalization factors before returning (normalization factors always preempt size factors),(即不同量级的数据要不要归一化)
replaced:返回极端值
dds <- makeExampleDESeqDataSet(m=4)  ##构建一个表达矩阵
head(counts(dds))
dds <- estimateSizeFactors(dds) # run this or DESeq() first
head(counts(dds, normalized=TRUE))
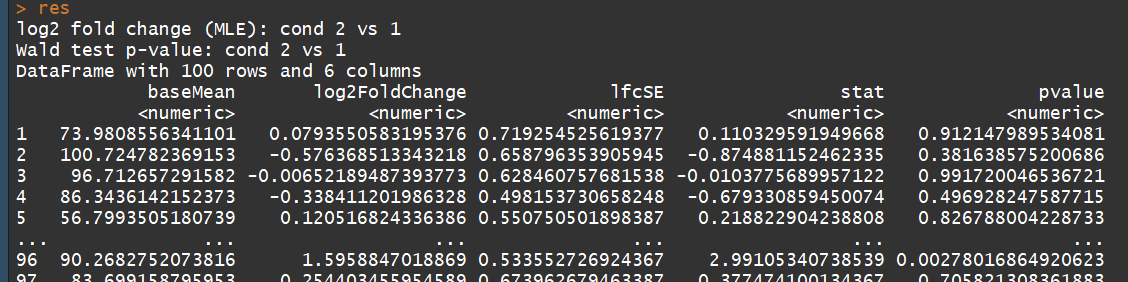
3.4)DESeq:Differential expression analysis based on the Negative Binomial (a.k.a.Gamma-Poisson) distribution(基于负二项分布进行差异分析)
语法:
DESeq(object, test = c("Wald", "LRT"), fitType = c("parametric", "local","mean"), sfType = c("ratio", "poscounts", "iterate"), betaPrior,full = design(object), reduced, quiet = FALSE,minReplicatesForReplace = 7, modelMatrixType, useT = FALSE, minmu = 0.5,
parallel = FALSE, BPPARAM = bpparam())
参数:
object:a DESeqDataSet object(表达矩阵对象)
test:Wald" or "LRT"检验
fitType:either "parametric", "local", or "mean"
sfType:either "ratio", "poscounts", or "iterate" for teh type of size factor estimation.
betaPrior:whether or not to put a zero-mean normal prior on the non-intercept coefficients
reduced:for test="LRT", a reduced formula to compare against
quiet:whether to print messages at each step
minReplicatesForReplace:the minimum number of replicates required
modelMatrixType:either "standard" or "expanded", which describe how the model matrix, X of the GLM formula is formed.
useT:logical, passed to nbinomWaldTest, default is FALSE
minmu:lower bound on the estimated count for fitting gene-wise dispersion
parallel:if FALSE, no parallelization. if TRUE, parallel execution using BiocParallel,
BPPARAM:an optional parameter object passed internally to bplapply when parallel=TRUE.
例子:
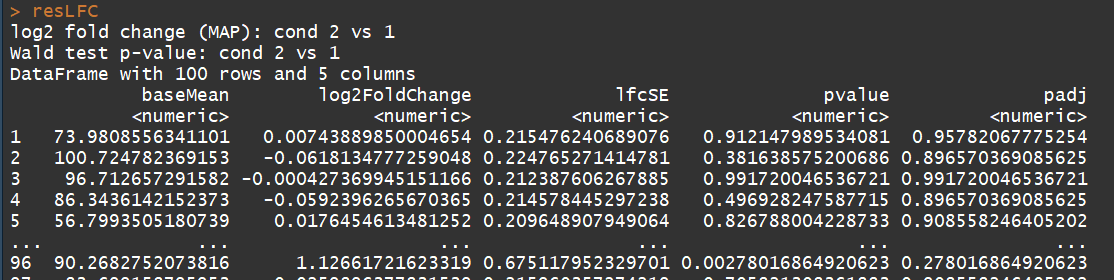
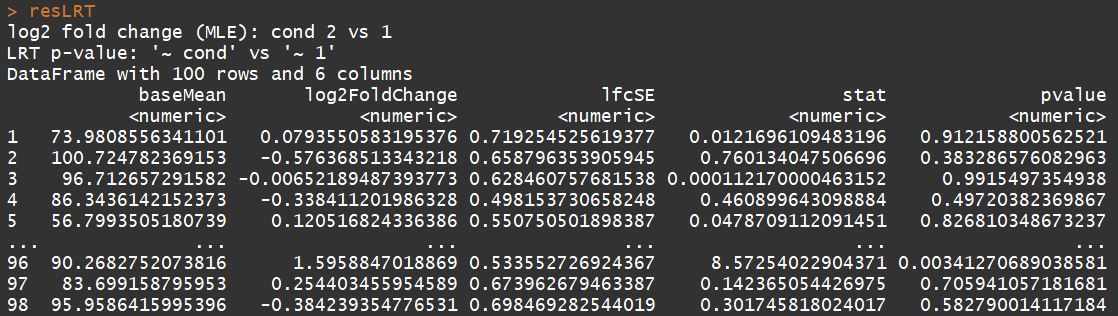
# count tables from RNA-Seq data
cnts <- matrix(rnbinom(n=1000, mu=100, size=1/0.5), ncol=10)
cond <- factor(rep(1:2, each=5))

# object construction
dds <- DESeqDataSetFromMatrix(cnts, DataFrame(cond), ~ cond)

# standard analysis
dds <- DESeq(dds)
res <- results(dds)

# moderated log2 fold changes
resultsNames(dds)
resLFC <- lfcShrink(dds, coef=2, type="apeglm")

# an alternate analysis: likelihood ratio test
ddsLRT <- DESeq(dds, test="LRT", reduced= ~ 1)
resLRT <- results(ddsLRT)
3.5)DESeqDataSet-class(DESeqDataSet object and constructors)
语法:
DESeqDataSet(se, design, ignoreRank = FALSE)
DESeqDataSetFromMatrix(countData, colData, design, tidy = FALSE,ignoreRank = FALSE, ...)
DESeqDataSetFromHTSeqCount(sampleTable, directory = ".", design,ignoreRank = FALSE, ...)
DESeqDataSetFromTximport(txi, colData, design, ...)
例子:
countData <- matrix(1:100,ncol=4)
condition <- factor(c("A","A","B","B"))
dds <- DESeqDataSetFromMatrix(countData, DataFrame(condition), ~ condition)
3.6)DESeqResults-class:DESeqResults object and constructor
语法:DESeqResults(DataFrame, priorInfo = list())
参数:
DataFrame:a DataFrame of results, standard column names are: baseMean, log2FoldChange,lfcSE, stat, pvalue, padj.
priorInfo:a list giving information on the log fold change prior
3.7)DESeqTransform-class(DESeqTransform object and constructor)
语法:DESeqTransform(SummarizedExperiment)
参数:SummarizedExperiment a RangedSummarizedExperiment
3.8)rlog Apply a ’regularized log’ transformation
用法:
rlog(object, blind = TRUE, intercept, betaPriorVar, fitType = "parametric")
rlogTransformation(object, blind = TRUE, intercept, betaPriorVar,fitType = "parametric")
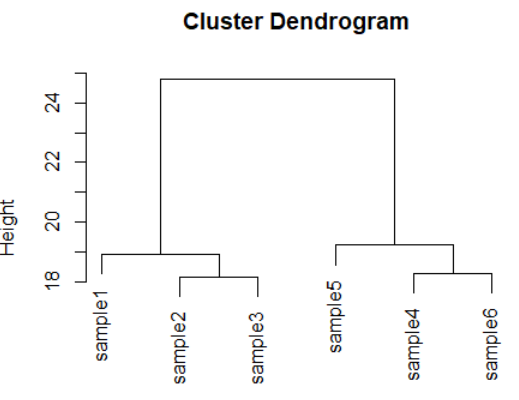
dds <- makeExampleDESeqDataSet(m=6,betaSD=1)
rld <- rlog(dds)
dists <- dist(t(assay(rld)))
plot(hclust(dists))
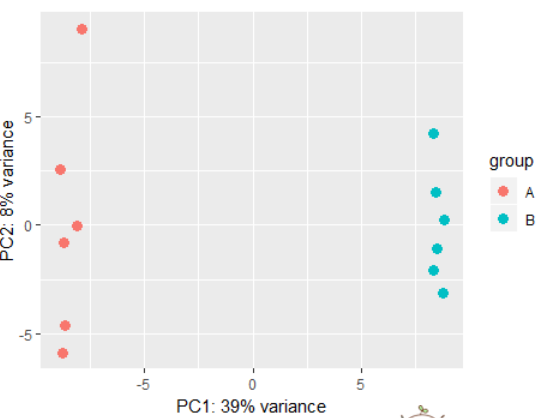
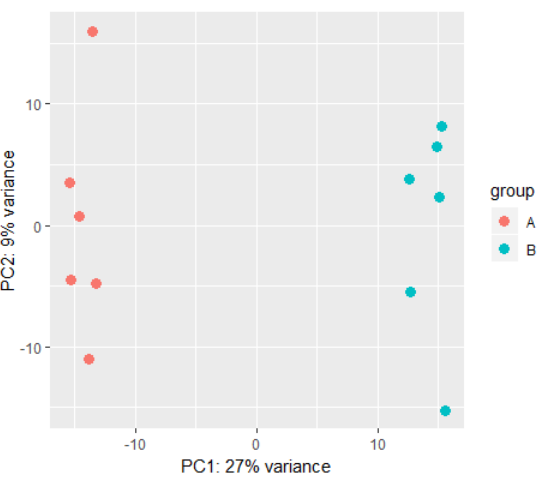
3.9)plotPCA(Sample PCA plot for transformed data)
用法:plotPCA(object, intgroup = "condition",ntop = 500, returnData = FALSE)
参数:
object:a DESeqTransform object, with data in assay(x), produced for example by either rlog or varianceStabilizingTransformation.
intgroup: interesting groups: a character vector of names in colData(x) to use for grouping
ntop:number of top genes to use for principal components, selected by highest row variance
returnData:should the function only return the data.frame of PC1 and PC2 with intgroup covariates for custom plotting
# using rlog transformed data:
dds <- makeExampleDESeqDataSet(betaSD=1)
rld <- rlog(dds)
plotPCA(rld)

# also possible to perform custom transformation:
dds <- estimateSizeFactors(dds)
# shifted log of normalized counts
se <- SummarizedExperiment(log2(counts(dds, normalized=TRUE) + 1),
colData=colData(dds))
# the call to DESeqTransform() is needed to
# trigger our plotPCA method.
plotPCA( DESeqTransform( se ) )
3.10)

 浙公网安备 33010602011771号