latex绘图小结
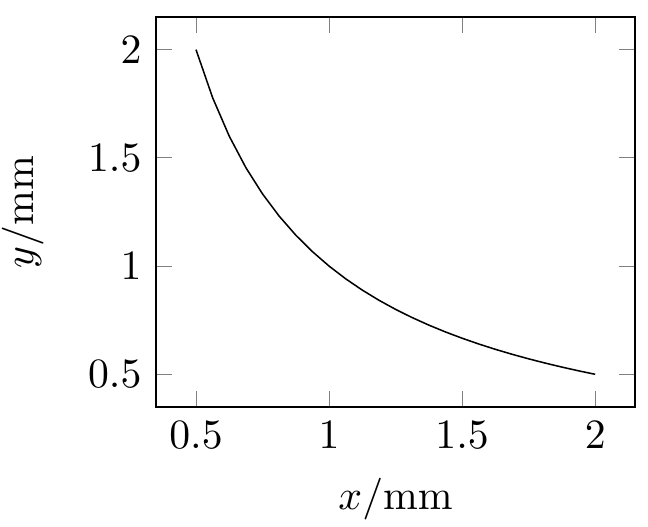
1.Latex简洁函数图
\documentclass[11pt]{article}
\usepackage{tikz}
\usepackage{pgfplots}

\begin{document}
\begin{tikzpicture}
\begin{axis}[
	xlabel=$x$/mm,
	ylabel=$y$/mm,
	width=6cm
	]
\addplot [
    domain=0.5:2
    ]{1/x};
\end{axis}
\end{tikzpicture}
\end{document}
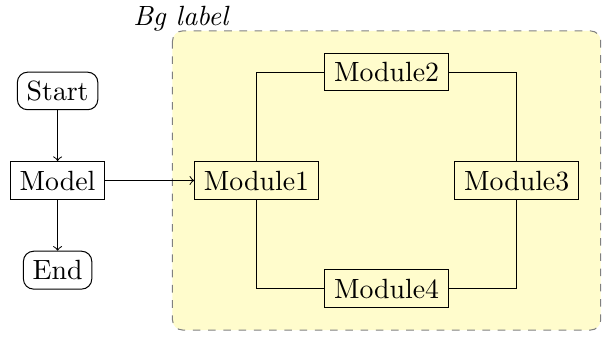
2.Latex流程图
参考自:https://www.cnblogs.com/deer2021/p/15096624.html
并适当简化
\documentclass[11pt]{article}
\usepackage{tikz}
\usetikzlibrary{graphs, positioning,shapes.geometric}

\begin{document}
\begin{tikzpicture}[node distance=2cm,x=0.6cm,y=0.6cm]
\node [draw, rounded corners] (start) {Start};
\node [draw, below=20pt of start] (model) {Model};
\node [draw, below=20pt of model, rounded corners] (end) {End};

\node [draw, right=35pt of model] (module1) {Module1};
\path (module1)+(6.0,0.0) node (module3) [draw] {Module3};
\path (module1)+(3,2.5) node (module2) [draw] {Module2};
\path (module1)+(3,-2.5) node (module4) [draw] {Module4};

\graph{
        (start) -> (model) -> (end);
        (model) -> (module1);
        (module1) --[to path={|- (\tikztotarget)}] (module2) --[to path={-| (\tikztotarget)}] (module3) --[to path={|- (\tikztotarget)}] (module4) --[to path={-| (\tikztotarget)}] (module1);
        };

\pgfdeclarelayer{background}
\pgfsetlayers{background,main}
\begin{pgfonlayer}{background}
\path (module1.west |- module2.north)+(-0.5,0.5) node (left_top) {};
\path (module3.east |- module4.south)+(+0.5,-0.5) node (right_bottom) {};
\path[fill=yellow!20,rounded corners, draw=black!50, dashed] (left_top) rectangle (right_bottom);
\path (left_top.east |- left_top.south) node (bg_label)[above] {\textit{Bg label}};
\end{pgfonlayer}

\end{tikzpicture}
\end{document}

 浙公网安备 33010602011771号