

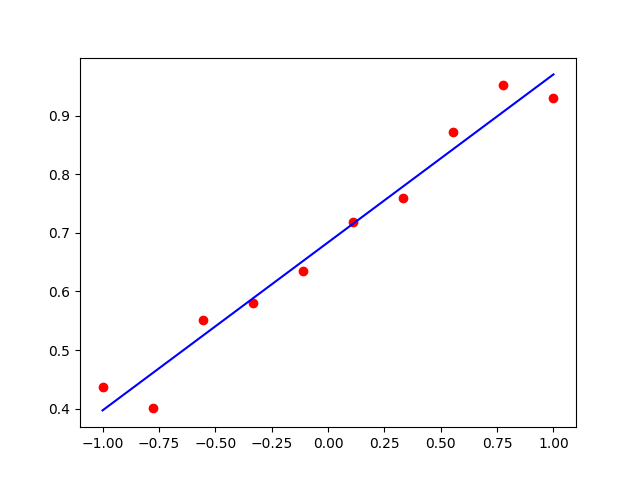
import tensorflow as tf
import numpy as np
import matplotlib.pyplot as plot

# 定义数据数量
xdata = []
ydata = []
# 生成数据
xdata = np.linspace(-1., 1., 10)  # 线性等分生成100个数据
# 拟合 y = a*x + b 的线性回归函数
# 定义 a=0.3,b=0.7,加上随机噪声
ydata = [0.3 * v + 0.7 + np.random.normal(0.0, 0.05) for v in xdata]

# 定义变量
a = tf.Variable(initial_value=0., dtype=tf.float32)
b = tf.Variable(initial_value=0., dtype=tf.float32)
variables = [a, b]

# 声明梯度下降优化算法
optimizer = tf.keras.optimizers.SGD(learning_rate=0.01)

# 声明循环迭代次数
num = 100
history_loss = []  # 记录每一次更新的loss值的变化
# 进行迭代,更新参数
for s in range(num):
    with tf.GradientTape() as tape:
        # 预测值
        y_pred = a * xdata + b
        # 损失函数
        loss = tf.reduce_sum(tf.square(y_pred - ydata))
        history_loss.append(loss)
        # 计算梯度
        grads = tape.gradient(loss, variables)
        # 更新参数
        optimizer.apply_gradients(grads_and_vars=zip(grads, variables))
        # 每隔100次输出一次结果
        if s % 10 == 0:
            print("step: %i, loss: %f, a: %f, b: %f" % (s, loss, a.numpy(), b.numpy()))

print(a.numpy(), b.numpy())
plot.scatter(xdata, ydata, c='r')
plot.plot(xdata, a * xdata + b, c='b')
plot.show()

# 画出loss曲线
plot.plot(np.arange(num), history_loss)
plot.title('loss')
plot.show()


 浙公网安备 33010602011771号