flask项目小案例、dataTables
一、结构
1、flask 项目结构
slowlog_analysis
├── __pycache__
│   ├── app.cpython-310.pyc
│   ├── config.cpython-310.pyc
│   └── config.cpython-312.pyc
├── app.py
├── config.py
├── csv
│   └── analysis_slow_log_row.csv
├── db
│   ├── __init__.py
│   ├── __pycache__
│   │   ├── __init__.cpython-310.pyc
│   │   └── db_operation.cpython-310.pyc
│   └── db_operation.py
├── mysql-slow.log
├── slow_log_analysis.py
├── slowlog_analysis
│   ├── __init__.py
│   ├── __pycache__
│   │   ├── __init__.cpython-310.pyc
│   │   └── views.cpython-310.pyc
│   ├── test.py
│   └── views.py
├── static
│   ├── css
│   │   ├── bootstrap.min.css
│   │   ├── bootstrap3.3.0.min.css
│   │   └── jquery.dataTables.min.css
│   └── js
│       ├── bootstrap.bundle.min.js
│       ├── bootstrap3.3.0.min.js
│       ├── jquery.dataTables.min.js
│       └── jquery3.5.1.min.js
├── templates
│   ├── index.html
│   └── slowlog_analysis.html
└── update_service.py

10 directories, 27 files
二、db
1、db 文件
import os
from sqlalchemy import create_engine, text

DB_TYPE_MYSQL, DB_TYPE_ORACLE = 'mysql', 'oracle'


class DbOperation():
    """数据库操作类"""

    def __init__(self):
        self._db_type = os.getenv('DB_TYPE', DB_TYPE_MYSQL)
        self._host = os.getenv('DB_HOST', 'ip')
        self._user = os.getenv('DB_USER', 'root')
        self._pwd = os.getenv('DB_PASSWORD', 'bigdata')
        self._port = int(os.getenv('DB_PORT', 3306))
        self._db_name = os.getenv('DB_MYSQL_MONITOR', 'monitor')
        url = f'mysql+pymysql://{self._user}:{self._pwd}@{self._host}:{self._port}/{self._db_name}?charset=utf8'
        self._engine = create_engine(url, echo=False, pool_size=5, pool_recycle=60, pool_pre_ping=True)

    def query_mysql_slow_log(self, start_time=None, size=100):
        where_clause = ""
        if start_time:
            where_clause = "WHERE start_time >= :start_time"
        sql = text(f'''
            SELECT * FROM {self._db_name}.mysql_slow_log
            {where_clause}
            ORDER BY create_time DESC
            LIMIT :size
        ''')
        with self._engine.connect() as conn:
            params = {"size": size}
            if start_time:
                params["start_time"] = start_time
            result = conn.execute(sql, params).fetchall()

        keys = result[0].keys() if result else []
        rows = [dict(zip(keys, row)) for row in result]
        return rows

    def query_mysql_slow_log_stat(self, start_time=None, size=100):
        where_clause = ""
        if start_time:
            where_clause = "WHERE start_time >= :start_time"
        sql = text(f'''
            SELECT * FROM {self._db_name}.mysql_slow_log_stat
            {where_clause}
            ORDER BY create_time DESC
            LIMIT :size
        ''')
        with self._engine.connect() as conn:
            params = {"size": size}
            if start_time:
                params["start_time"] = start_time
            result = conn.execute(sql, params).fetchall()

        keys = result[0].keys() if result else []
        rows = [dict(zip(keys, row)) for row in result]
        return rows

    def query_mysql_slow_log_exec_status(self):
        sql = text(
            'SELECT status,create_time FROM mysql_slow_log_exec_status '
            'WHERE status = \'success\' '
            'ORDER BY create_time '
            'DESC LIMIT 1')
        with self._engine.connect() as conn:
            result = conn.execute(sql).fetchall()

        keys = result[0].keys() if result else []
        rows = [dict(zip(keys, row)) for row in result]
        return rows

    def query_slow_log_data(self):
        sql = text(
            'SELECT start_time, user, query_duration, lock_table_duration, return_rows, scann_rows, exec_sql '
            'FROM mysql_slow_log '
            'WHERE start_time >= NOW() - INTERVAL 1 DAY')
        with self._engine.connect() as conn:
            result = conn.execute(sql).fetchall()

        keys = result[0].keys() if result else []
        rows = [dict(zip(keys, row)) for row in result]
        return rows

    def query_slow_log_stat_data(self):
        sql = text(
            'SELECT start_time, end_time, user, avg_query_duration, lock_table_duration, return_rows, scann_rows, count, exec_sql '
            'FROM mysql_slow_log_stat '
            'WHERE end_time >= NOW() - INTERVAL 1 DAY')
        with self._engine.connect() as conn:
            result = conn.execute(sql).fetchall()

        keys = result[0].keys() if result else []
        rows = [dict(zip(keys, row)) for row in result]
        return rows


db_manager = DbOperation()
补充sqlalchemy 版本问题:
SQLAlchemy 1.3.x版本,没有.mappings().all()方法
对于每个查询结果,可以使用fetchall()、fetchone()等方法,然后将每行结果转换为字典,使用dict(zip(keys, row))将行转化为字典。
2、app核心文件
import os
import config
import datetime
from flask import Flask, render_template
from flask_cors import CORS
from slowlog_analysis import slowlog_analysis_bp
from flask_uploads import UploadSet, configure_uploads, ARCHIVES, DOCUMENTS


basedir = os.path.abspath(os.path.dirname(__file__))
upload_root_path = os.path.join(basedir, 'uploads')
config.upload_root_path = upload_root_path

app = Flask(__name__, template_folder='./templates', static_folder="static", static_url_path=config.APP_URL_PREFIX)
CORS(app, supports_credentials=True)

app.config['SESSION_COOKIE_NAME'] = '/serviceops'
app.config['SECRET_KEY'] = 'hello-healsci-service-ops'
app.config['MAX_CONTENT_LENGTH'] = 6 * 1024 * 1024 * 1024
app.config['UPLOADED_ARCHIVES_DEST'] = upload_root_path
app.config['UPLOADED_DATAFILES_DEST'] = upload_root_path
app.config['PERMANENT_SESSION_LIFETIME'] = datetime.timedelta(seconds=3600)
archives = UploadSet('archives', ARCHIVES)
docs = UploadSet('datafiles', DOCUMENTS)
configure_uploads(app, [archives, docs])
app.register_blueprint(slowlog_analysis_bp, url_prefix=config.APP_URL_PREFIX)
# logging.basicConfig(level=logging.DEBUG)


@app.route('/')
def hello_world():
    return render_template('index.html')


if __name__ == '__main__':
    app.run()
三、视图
1、html
<!DOCTYPE html>
<html lang="zh">
<head>
    <meta charset="UTF-8">
    <meta name="viewport" content="width=device-width, initial-scale=1.0">
    <title>MySQL 慢查询日志分析</title>

    <!-- CSS 引入 -->
    <link href="{{ url_for('static', filename='css/bootstrap.min.css') }}" rel="stylesheet">
    <link href="{{ url_for('static', filename='css/jquery.dataTables.min.css') }}" rel="stylesheet">

    <!-- JS 引入 -->
    <script src="{{ url_for('static', filename='js/jquery3.5.1.min.js') }}"></script>
    <script src="{{ url_for('static', filename='js/bootstrap.bundle.min.js') }}"></script>
    <script src="{{ url_for('static', filename='js/jquery.dataTables.min.js') }}"></script>

    <script>
        let aggregatedTable, rawTable;
        let selectedPeriod = 'One day'; // 默认选择一天

        $(document).ready(function () {
            aggregatedTable = $('#aggregatedTable').DataTable({
                pageLength: 25,
                order: [[0, 'desc']]
            });

            rawTable = $('#rawTable').DataTable({
                pageLength: 25,
                order: [[0, 'desc']]
            });

            fetch("{{ url_for('slowlog_analysis.get_mysql_slow_log_exec_status') }}")
                .then(response => response.json())
                .then(data => {
                    if (data.code === 200) {
                        $('#lastSuccessTime').text(data.data);
                    } else {
                        $('#lastSuccessTime').text('未加载');
                    }
                })
                .catch(error => {
                    $('#lastSuccessTime').text('加载失败');
                });

            // 下载CSV按钮
            $('#downloadCsvBtn').click(function () {
                window.location.href = "{{ url_for('slowlog_analysis.download_slow_log_files') }}";
            });

            // 检索按钮点击事件,用于默认一天的检索
            $('#searchBtn').click(function () {
                analyzeSlowLog(selectedPeriod);
            });

            // 下拉菜单选择时间段
            $('.dropdown-item').click(function () {
                selectedPeriod = $(this).text(); // 更新选择
                analyzeSlowLog(selectedPeriod);
            });
        });

        function analyzeSlowLog(period) {
            $('#loading').show();
            aggregatedTable.clear();
            rawTable.clear();

            fetch("{{ url_for('slowlog_analysis.get_mysql_slow_log_stat') }}?period=" + encodeURIComponent(period), {
                method: 'GET',
                headers: {
                    'Content-Type': 'application/json'
                }
            })
                .then(response => response.json())
                .then(data => {
                    $('#loading').hide();
                    if (data.code === 200) {
                        data.data.forEach(item => {
                            aggregatedTable.row.add([
                                item['id'],
                                `${item['start_time']} - ${item['end_time']}`,
                                item['user'],
                                item['avg_query_duration'],
                                item['lock_table_duration'],
                                item['return_rows'],
                                item['scann_rows'],
                                item['count'],
                                item['exec_sql']
                            ]).draw();
                        });
                    } else {
                        alert('分析失败: ' + data.error);
                    }
                })
                .catch(error => {
                    $('#loading').hide();
                    alert('请求失败: ' + error.message);
                });

            fetch("{{ url_for('slowlog_analysis.get_mysql_slow_log') }}?period=" + encodeURIComponent(period), {
                method: 'GET',
                headers: {
                    'Content-Type': 'application/json'
                }
            })
                .then(response => response.json())
                .then(data => {
                    if (data.code === 200) {
                        data.data.forEach(item => {
                            rawTable.row.add([
                                item['id'],
                                item['start_time'],
                                item['user'],
                                item['query_duration'],
                                item['lock_table_duration'],
                                item['return_rows'],
                                item['scann_rows'],
                                item['exec_sql']
                            ]).draw();
                        });
                    } else {
                        alert('分析失败: ' + data.error);
                    }
                })
                .catch(error => {
                    $('#loading').hide();
                    alert('请求失败: ' + error.message);
                });
        }
    </script>
</head>
<body>
<div class="container mt-4">
    <div class="d-flex justify-content-between align-items-center mb-4">
        <h1 class="mb-0">MySQL 慢查询日志分析</h1>
    </div>

    <div class="row mb-4">
        <div class="col d-flex align-items-center">
            <div class="btn-group me-3">
                <button type="button" class="btn btn-primary" id="searchBtn">检索</button>
                <button type="button" class="btn btn-primary dropdown-toggle dropdown-toggle-split"
                        data-bs-toggle="dropdown" aria-expanded="false">
                    <span class="visually-hidden">Toggle Dropdown</span>
                </button>
                <ul class="dropdown-menu">
                    <li><a class="dropdown-item" href="#">One day</a></li>
                    <li><a class="dropdown-item" href="#">One week</a></li>
                    <li><a class="dropdown-item" href="#">Two weeks</a></li>
                </ul>
            </div>

            <button class="btn btn-primary" id="downloadCsvBtn">CSV下载</button>
            <h5 class="text-muted mb-0 ms-3">脚本更新时间:<span id="lastSuccessTime">加载中...</span></h5>
        </div>
    </div>

    <div id="loading" style="display: none;">
        <div class="spinner-border text-primary" role="status">
            <span class="visually-hidden">Loading...</span>
        </div>
        <span class="ms-2">分析中,请稍候...</span>
    </div>

    <div id="results" class="mt-4">
        <ul class="nav nav-tabs" id="resultTabs" role="tablist">
            <li class="nav-item">
                <a class="nav-link" id="raw-tab" data-bs-toggle="tab" href="#raw" role="tab">聚合前</a>
            </li>
            <li class="nav-item">
                <a class="nav-link active" id="aggregated-tab" data-bs-toggle="tab" href="#aggregated"
                   role="tab">聚合后</a>
            </li>
        </ul>

        <div class="tab-content mt-3">
            <div class="tab-pane fade show active" id="aggregated" role="tabpanel">
                <table id="aggregatedTable" class="table table-striped">
                    <thead>
                    <tr>
                        <th>ID</th>
                        <th>时间范围</th>
                        <th>账户</th>
                        <th>平均查询时间(s)</th>
                        <th>锁表时间(s)</th>
                        <th>返回行数</th>
                        <th>扫描行数</th>
                        <th>执行次数</th>
                        <th>SQL</th>
                    </tr>
                    </thead>
                    <tbody></tbody>
                </table>
            </div>
            <div class="tab-pane fade" id="raw" role="tabpanel">
                <table id="rawTable" class="table table-striped">
                    <thead>
                    <tr>
                        <th>ID</th>
                        <th>开始时间</th>
                        <th>账户</th>
                        <th>查询时间(s)</th>
                        <th>锁表时间(s)</th>
                        <th>返回行数</th>
                        <th>扫描行数</th>
                        <th>SQL</th>
                    </tr>
                    </thead>
                    <tbody></tbody>
                </table>
            </div>
        </div>
    </div>
</div>
</body>
</html>
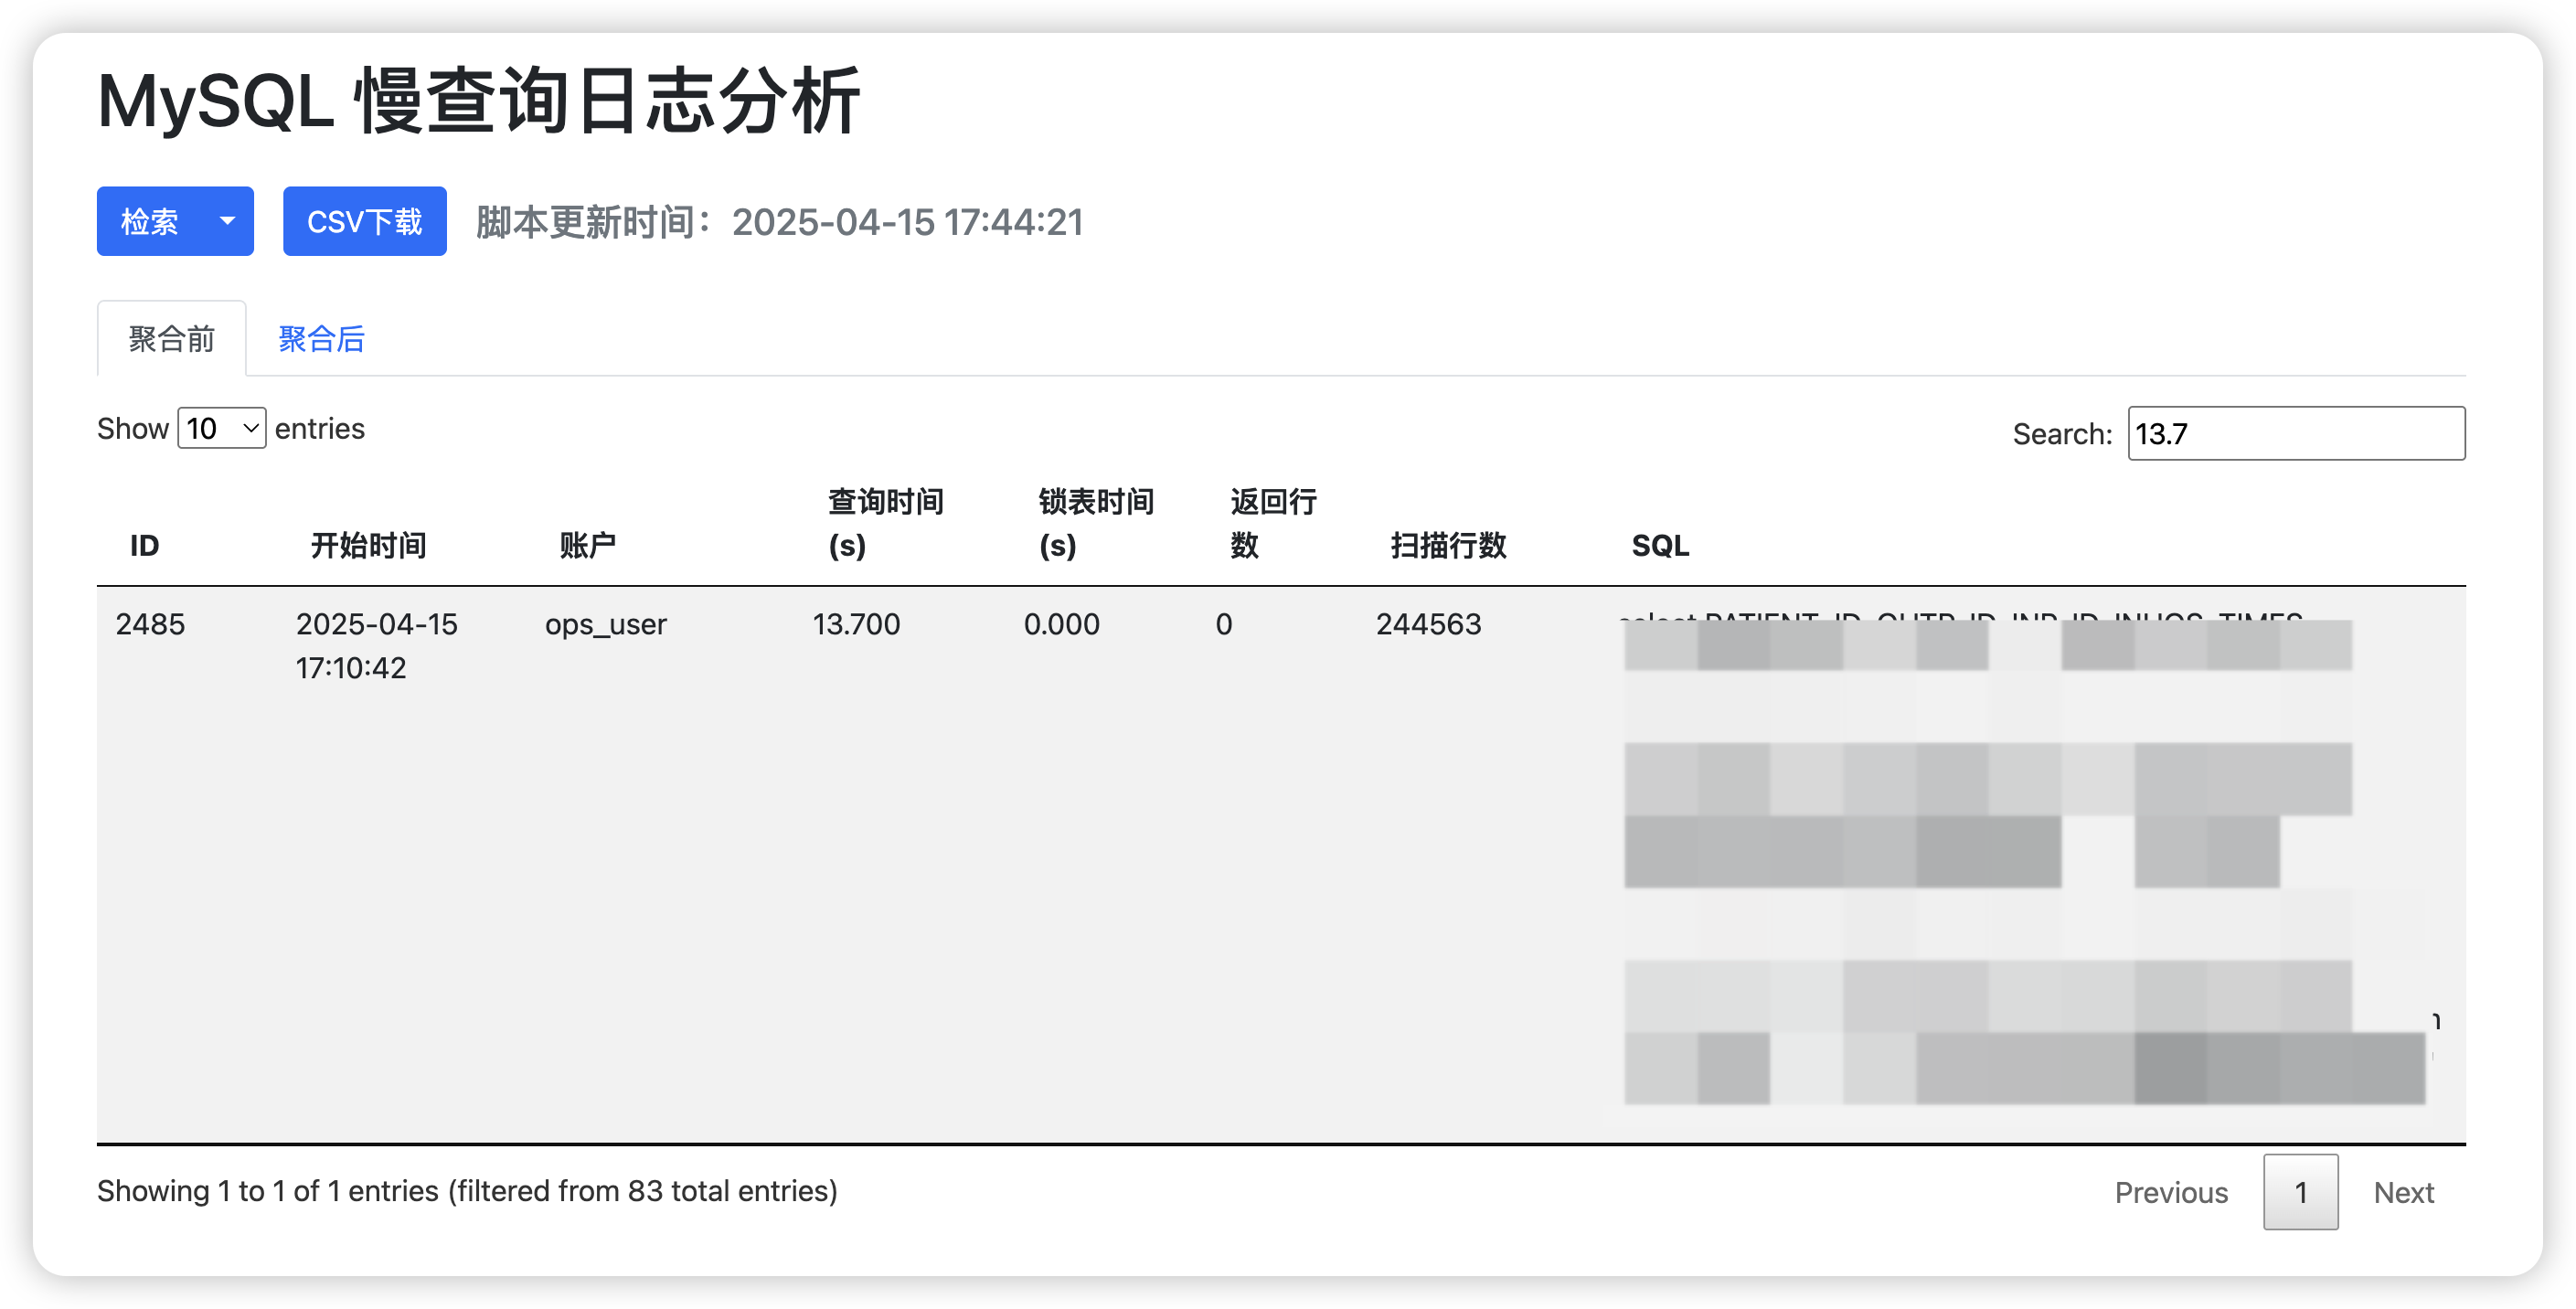
2、dataTables 效果
支持分页、搜索、按照指定列排序、一页展示的行数
3、DataTables介绍
是一个功能强大的 jQuery 插件,用于在网页上实现动态、交互式的表格。它提供了丰富的功能,可以轻松地管理大数据量的 HTML 表格,并允许用户进行排序、搜索、分页等操作。
https://github.com/DataTables/DataTables 官方仓库
https://rstudio.github.io/DT/
主要功能:
- 排序:支持各种数据类型的列排序,并允许多列排序。
- 搜索:可在整个表格或特定列中快速查找数据。
- 分页:自动分页功能,帮助用户轻松浏览大量数据。
- 响应式:自适应布局,支持移动设备友好显示。
- 数据处理:可以直接使用 HTML 表格数据,也支持通过 Ajax 加载数据。
- 插件扩展:支持各种插件扩展,如导出数据(Excel、PDF)、打印视图等。
- 自定义:高度可定制化,用户可以根据需要调整外观和功能。

 浙公网安备 33010602011771号