2025,每天10分钟,跟我学K8S(四十九)- 日志收集
在日常k8s的使用中,由于应用都是运行在pod中的,所以日志文件也一般都会存储在pod中,那如何收集这一块的日志内容?K8S官方给了以下三种方案。
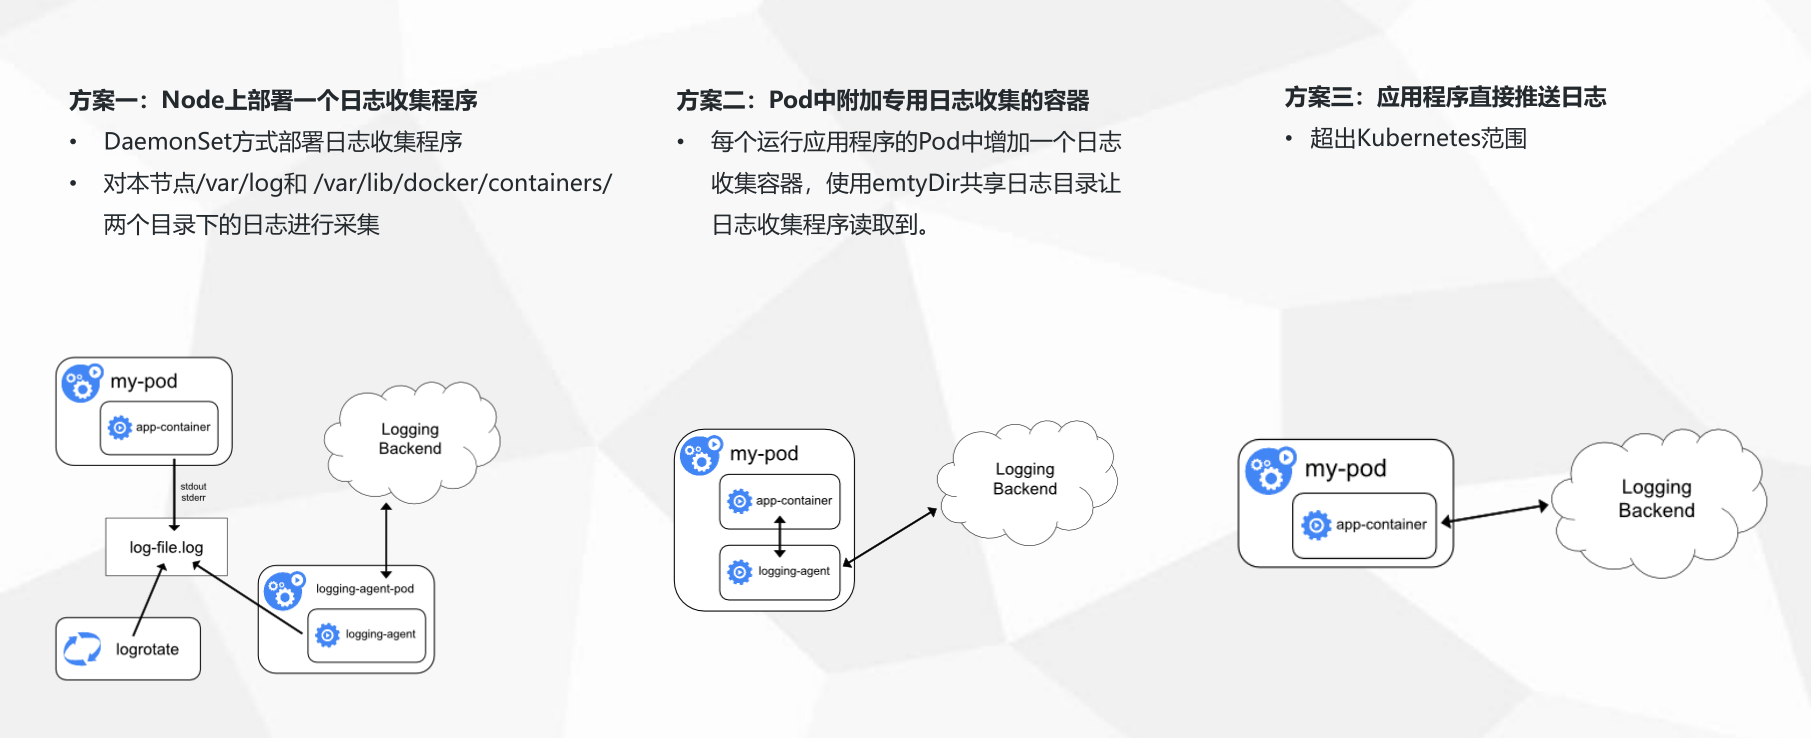
三种收集方案的优缺点:
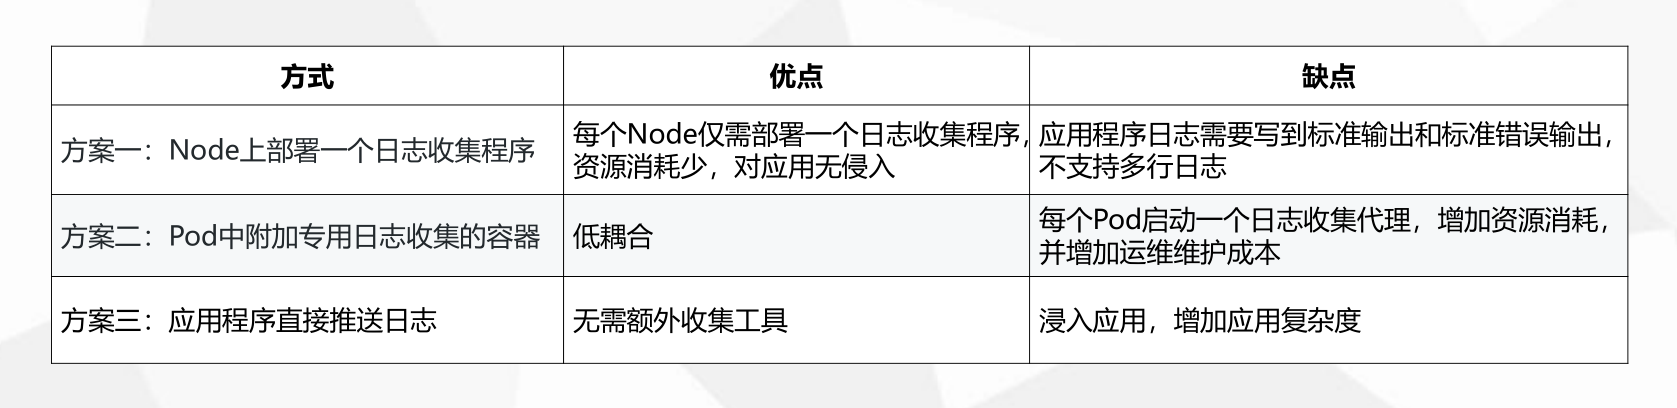
三种方案各有自己的优缺点,但是综合比较下来,一般都是建议使用第二种方案,也是官方推荐的一种。
在同一个pod中运行2个容器,第一个容器运行业务程序,第二个容器运行日志收集程序,两个容器共享一个日志目录,当第一个业务程序将日志写入到日志目录后,日志收集程序将共享目录中的日志源文件进行收集并上传。
本章内容,就来一起了解下这种方案的具体操作过程。市面上日志收集处理的工具有很多,本文采用filebeat + elasticsearch的组合。大部分情况可以在filebeat 后面增加一个redis/kafka+logstash,来缓存数据和处理数据,得到想要的数据类型再进行上传到es中。这种后面有机会的话再来单章分析。
1.部署elasticsearch
创建es.yaml文件,用来创建es后端服务
root@k8s-master:~/tmp/root/elk# cat es.yaml

#pvc  create longhorn pvc
apiVersion: v1
kind: PersistentVolumeClaim
metadata:
  name: es-pv-claim
  labels:
    type: longhorn
    app: es
spec:
  storageClassName: longhorn
  accessModes:
    - ReadWriteOnce
  resources:
    requests:
      storage: 10Gi
---
#ConfigMap create es config
apiVersion: v1
kind: ConfigMap
metadata:
  name: es
data:
  elasticsearch.yml: |
    cluster.name: my-cluster
    node.name: node-1
    node.max_local_storage_nodes: 3
    network.host: 0.0.0.0
    http.port: 9200
    discovery.seed_hosts: ["127.0.0.1", "[::1]"]
    cluster.initial_master_nodes: ["node-1"]
    http.cors.enabled: true
    http.cors.allow-origin: /.*/
---
#Deployment create es pod
apiVersion: apps/v1
kind: Deployment
metadata:
  name: elasticsearch
spec:
  selector:
    matchLabels:
      name: elasticsearch
  replicas: 1
  template:
    metadata:
      labels:
        name: elasticsearch
    spec:
      securityContext:
        fsGroup: 1000  # 关键:适配 Elasticsearch 用户组
      initContainers:
      - name: init-sysctl
        image: m.daocloud.io/docker.io/busybox:latest
        command:
        - sysctl
        - -w
        - vm.max_map_count=262144
        securityContext:
          privileged: true
      containers:
      - name: elasticsearch
        image: m.daocloud.io/docker.io/elasticsearch:7.6.2
        imagePullPolicy: IfNotPresent
        resources:
          limits:
            cpu: 1000m
            memory: 2Gi
          requests:
            cpu: 100m
            memory: 1Gi
        env:
        - name: ES_JAVA_OPTS
          value: -Xms512m -Xmx512m
        ports:
        - containerPort: 9200
        - containerPort: 9300
        volumeMounts:
        - name: elasticsearch-data
          mountPath: /usr/share/elasticsearch/data/
        - name: es-config
          mountPath: /usr/share/elasticsearch/config/elasticsearch.yml
          subPath: elasticsearch.yml
      volumes:
      - name: elasticsearch-data
        persistentVolumeClaim:
          claimName: es-pv-claim
      - name: es-config
        configMap:
          name: es
---
#Service  create es Service
apiVersion: v1
kind: Service
metadata:
  name: elasticsearch
  labels:
    name: elasticsearch
spec:
  type: NodePort
  ports:
  - name:  web-9200
    port: 9200
    targetPort: 9200
    protocol: TCP
    nodePort: 30105
  - name:  web-9300
    port: 9300
    targetPort: 9300
    protocol: TCP
    nodePort: 30106
  selector:
    name: elasticsearch


# kubectl apply -f es.yaml
persistentvolumeclaim/es-pv-claim created
configmap/es created
deployment.apps/elasticsearch created
service/elasticsearch created
2.创建一个nginx的pod
同一个pod中运行2个容器,第一个容器运行业务程序,第二个容器运行日志收集程序,两个容器共享一个日志目录,当第一个业务程序将日志写入到日志目录后,日志收集程序将共享目录中的日志源文件进行收集并上传。
2.1 创建config
# cat nginx_test_configmap.yaml
---
# Filebeat 配置文件 ConfigMap
apiVersion: v1
kind: ConfigMap
metadata:
  name: filebeat-config
data:
  filebeat.yml: |
    filebeat.inputs:
    - type: log
      enabled: true
      paths:
        - /var/log/nginx/access.log
        - /var/log/nginx/error.log
      fields:
        app: nginx
      fields_under_root: true

    processors:
      - add_kubernetes_metadata:
          matchers:
          - logs_path:
              logs_path: "/var/log/containers/"

    output.elasticsearch:
      hosts: ["elasticsearch.default.svc.cluster.local:9200"]
      indices:
        - index: "nginx-logs-%{+yyyy.MM.dd}"
2.2 创建rbac
这里是由于默认的filebeat容器是使用非root用户,所以需要给对应的容器创建sa用户,赋予权限
# cat nginx_test_rbac.yaml
---
apiVersion: v1
kind: ServiceAccount
metadata:
  name: filebeat-sa
---
apiVersion: rbac.authorization.k8s.io/v1
kind: ClusterRoleBinding
metadata:
  name: filebeat-role-binding
subjects:
- kind: ServiceAccount
  name: filebeat-sa
  namespace: default
roleRef:
  kind: ClusterRole
  name: view
  apiGroup: rbac.authorization.k8s.io
2.3 创建deployment和service
这里是关键步骤,一个deployment下面运行了两个containers,一个是nginx,用于模拟后台;一个是filebeat,用于收集日志。 两个containers共享了nginx-logs 这个存储卷,所以filebeat才能访问到nginx的日志
# cat nginx_test_deploy.yaml
apiVersion: apps/v1
kind: Deployment
metadata:
  name: nginx-with-filebeat
spec:
  replicas: 1
  selector:
    matchLabels:
      app: nginx-with-filebeat
  template:
    metadata:
      labels:
        app: nginx-with-filebeat
    spec:
      # 使用上面rbac创建的sa用户来作为容器中的用户
      serviceAccountName: filebeat-sa
      containers:
      # Nginx 主容器
      - name: nginx
        image: m.daocloud.io/docker.io/nginx:latest
        ports:
        - containerPort: 80
        volumeMounts:
        - name: nginx-logs
          mountPath: /var/log/nginx
      # Filebeat 日志采集 Sidecar 容器
      - name: filebeat
        image: docker.elastic.co/beats/filebeat:7.6.2
        args: ["-c", "/etc/filebeat.yml", "-e"]
        volumeMounts:
        - name: nginx-logs
          mountPath: /var/log/nginx
        - name: filebeat-config
          mountPath: /etc/filebeat.yml
          subPath: filebeat.yml
        securityContext:
          runAsUser: 0  # 以 root 运行(避免日志文件权限问题)

      # 共享存储卷定义
      volumes:
      - name: nginx-logs
        emptyDir: {}  # 日志存储(可根据需求改为 PVC,但是上传到了es就没必要再存在pv了)
      - name: filebeat-config
        configMap:
          name: filebeat-config
3.部署kibana查看数据
# cat kibana.yaml
# Kibana Deployment
apiVersion: apps/v1
kind: Deployment
metadata:
  name: kibana
  namespace: default
spec:
  replicas: 1
  selector:
    matchLabels:
      app: kibana
  template:
    metadata:
      labels:
        app: kibana
    spec:
      containers:
      - name: kibana
        image: docker.elastic.co/kibana/kibana:7.6.2  # 版本需与 Elasticsearch 一致
        env:
        - name: ELASTICSEARCH_HOSTS  # 关键配置:指向 Elasticsearch 地址
          value: "http://elasticsearch.default.svc.cluster.local:9200"
        ports:
        - containerPort: 5601
        resources:
          limits:
            memory: 1Gi
            cpu: "1"
          requests:
            memory: 512Mi
            cpu: "0.5"
---
# Kibana Service
apiVersion: v1
kind: Service
metadata:
  name: kibana
  namespace: default
spec:
  type: NodePort  # 生产环境建议使用 Ingress
  ports:
  - port: 5601
    targetPort: 5601
    nodePort: 30601  # 自定义端口范围(30000-32767)
  selector:
    app: kibana
4.应用
kubectl apply -f es.yaml

kubectl apply -f nginx_test_configmap.yaml
kubectl apply -f nginx_test_deploy.yaml
kubectl apply -f nginx_test_rbac.yaml

kubectl apply -f kibana.yaml
5.验证日志数据
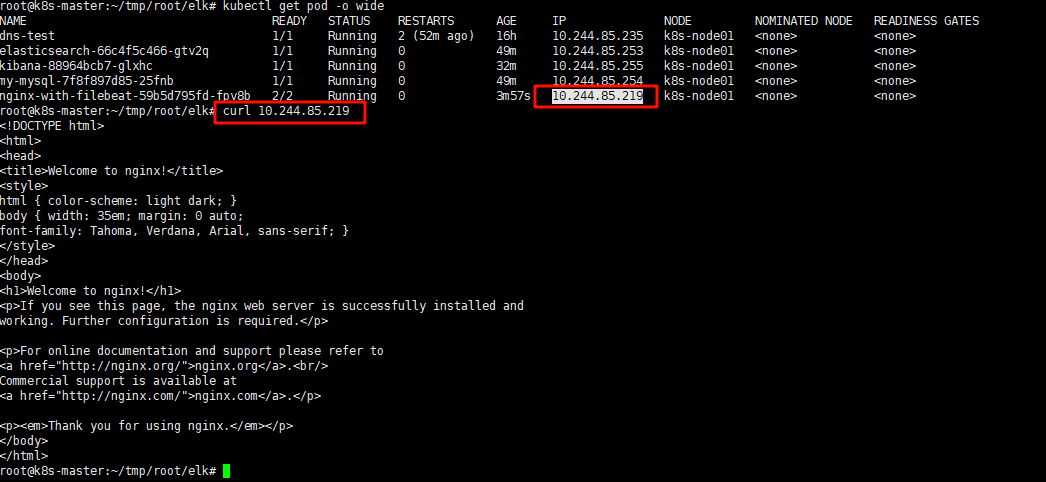
5.1 手动创造日志
获取nginx的IP,通过curl请求模拟一次访问,创建一条日志
# kubectl get pod -o wide
NAME                                   READY   STATUS    RESTARTS      AGE     IP              NODE         NOMINATED NODE   READINESS GATES
elasticsearch-66c4f5c466-gtv2q         1/1     Running   0             49m     10.244.85.253   k8s-node01   <none>           <none>
kibana-88964bcb7-glxhc                 1/1     Running   0             32m                1/1     Running   0             49m     10.244.85.254   k8s-node01   <none>           <none>
nginx-with-filebeat-59b5d795fd-fpv8b   2/2     Running   0             3m57s   10.244.85.219   k8s-node01   <none>           <none>


# curl 10.244.85.219
<!DOCTYPE html>
<html>
<head>
<title>Welcome to nginx!</title>
<style>
....
5.2 验证日志
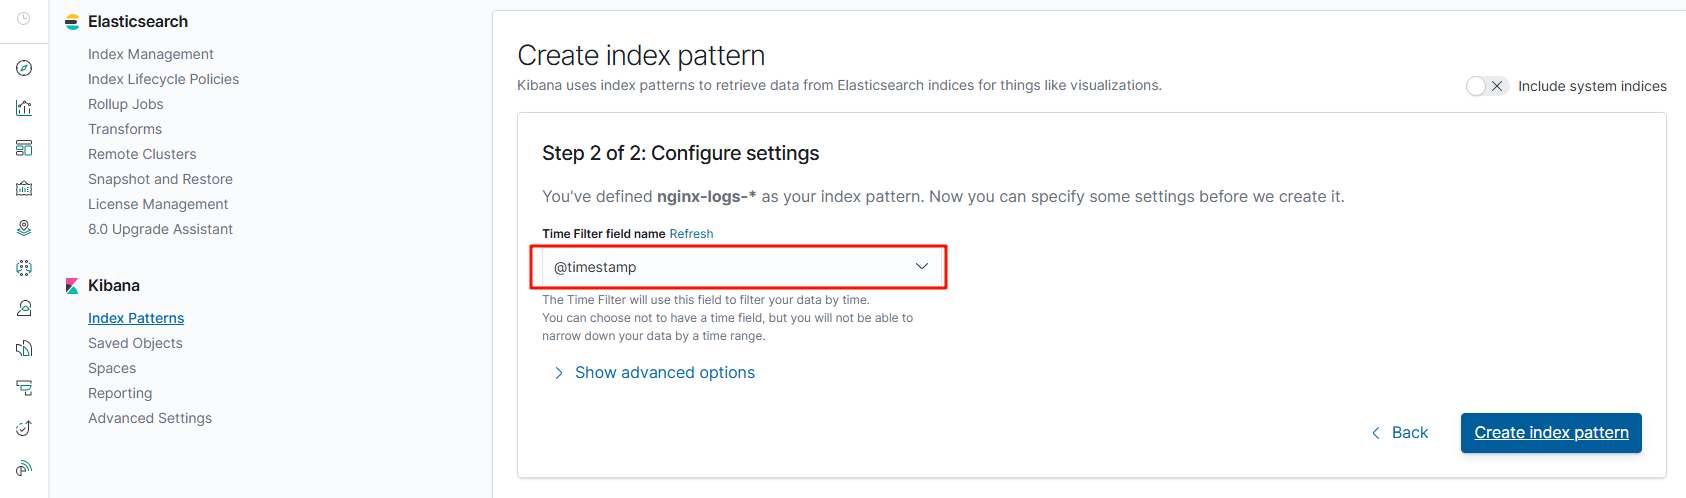
1. 登录kibana,点击左上角的discover,出来的页面右侧创建索引模式,输入nginx-logs-*,这样可以匹配所有以nginx-logs- 开头的日志
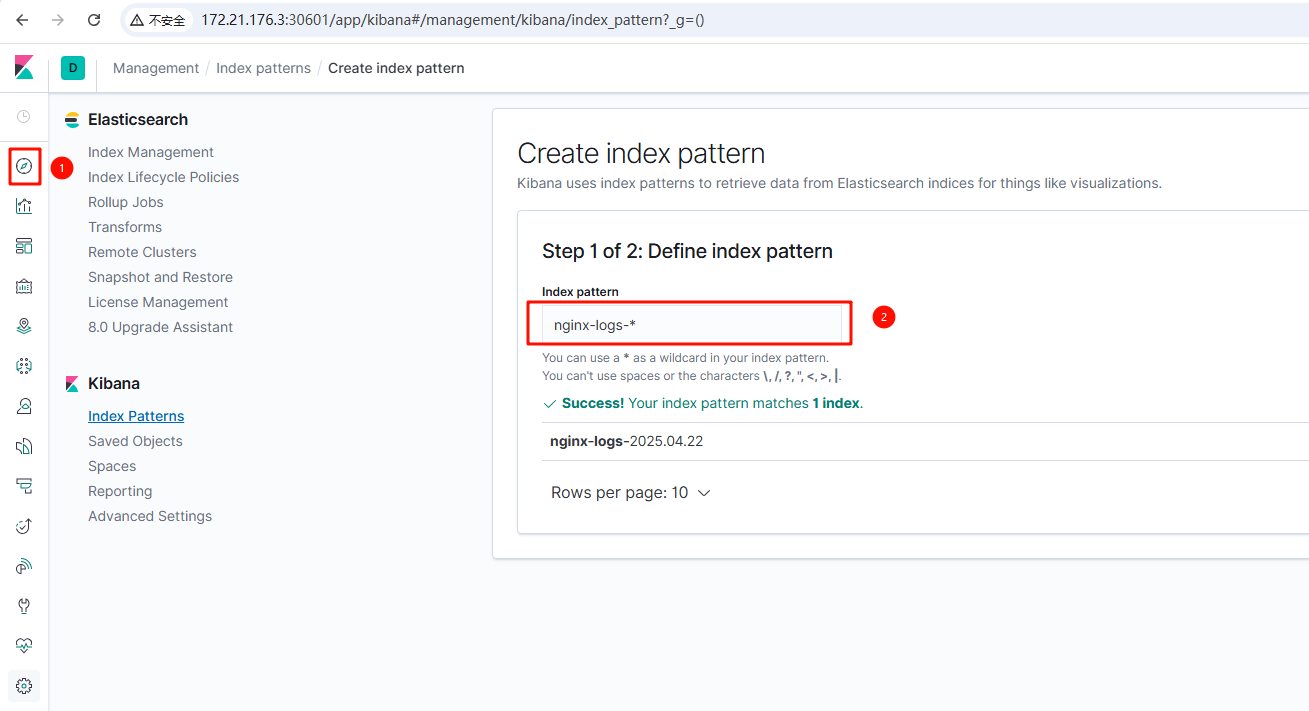
2.下一步后添加一个时间字段,完成创建
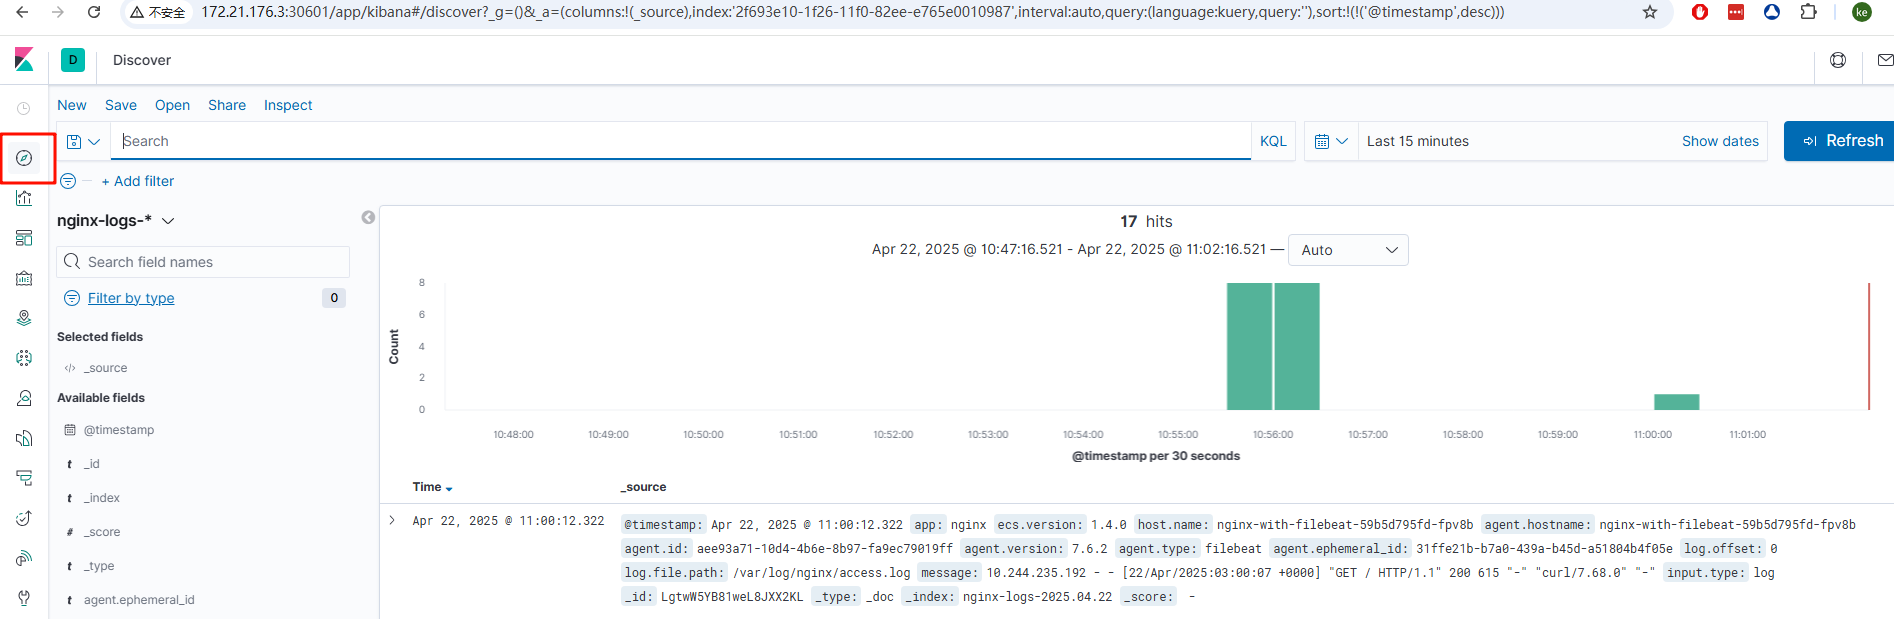
3. 再次点击左上角discover 即可看到nginx的日志

 浙公网安备 33010602011771号