Pandas数据处理+Matplotlib绘图案例
利用pandas对数据进行预处理然后再使用matplotlib对处理后的数据进行数据可视化是数据分析中常用的方法。
第一组例子(星巴克咖啡店)
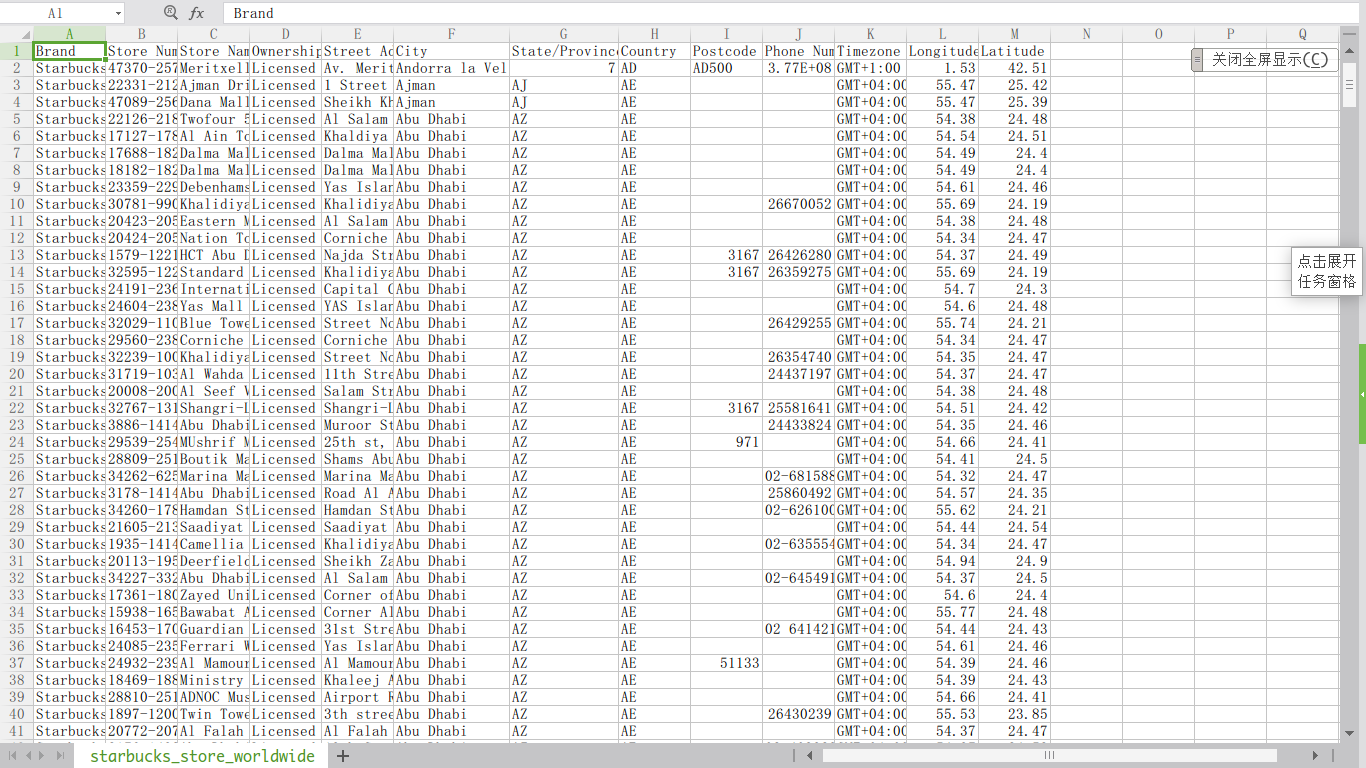
假如我们现在有这样一组数据:星巴克在全球的咖啡店信息,如下图所示。数据来源:starbucks_store_locations。
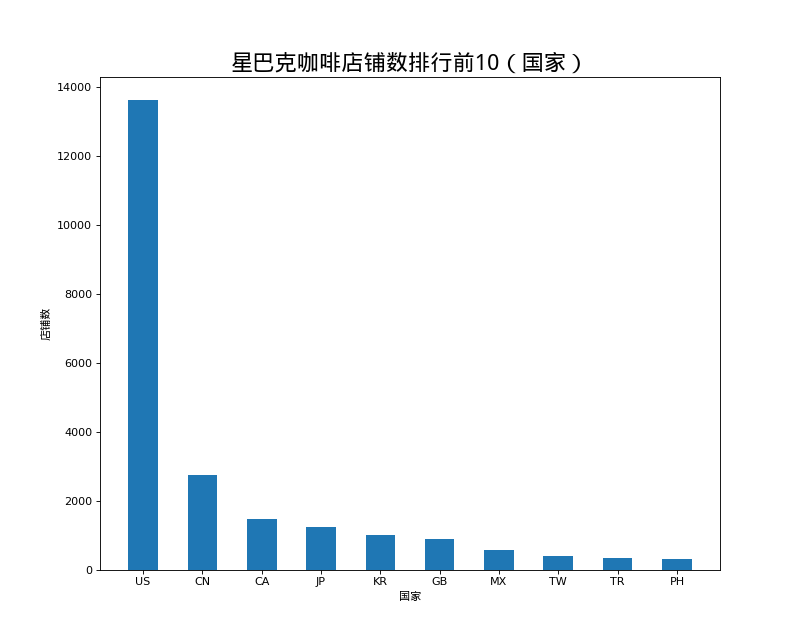
店铺总数排名前10的国家
# coding=utf-8
# 统计店铺数排名前10的国家
import pandas as pd
from matplotlib import pyplot as plt
from matplotlib import font_manager

# 准备工作
font = font_manager.FontProperties(fname="/usr/share/fonts/truetype/wqy/wqy-microhei.ttc")
file_path = "./starbucks_store_worldwide.csv"
df = pd.read_csv(file_path)

# 处理数据
data1 = df.groupby(by="Country").count().sort_values(by="Brand", ascending=False)[:10]["Brand"]
_x = data1.index
_y = data1.values

# 画图
plt.figure(figsize=(10,8), dpi=80)
plt.bar(range(len(_x)), _y, width=0.5)

plt.xticks(range(len(_x)), _x)
plt.xlabel("国家", fontproperties=font)
plt.ylabel("店铺数", fontproperties=font)
plt.title("星巴克咖啡店铺数排行前10(国家)", fontproperties=font, size=20)
plt.show()
结果如图:
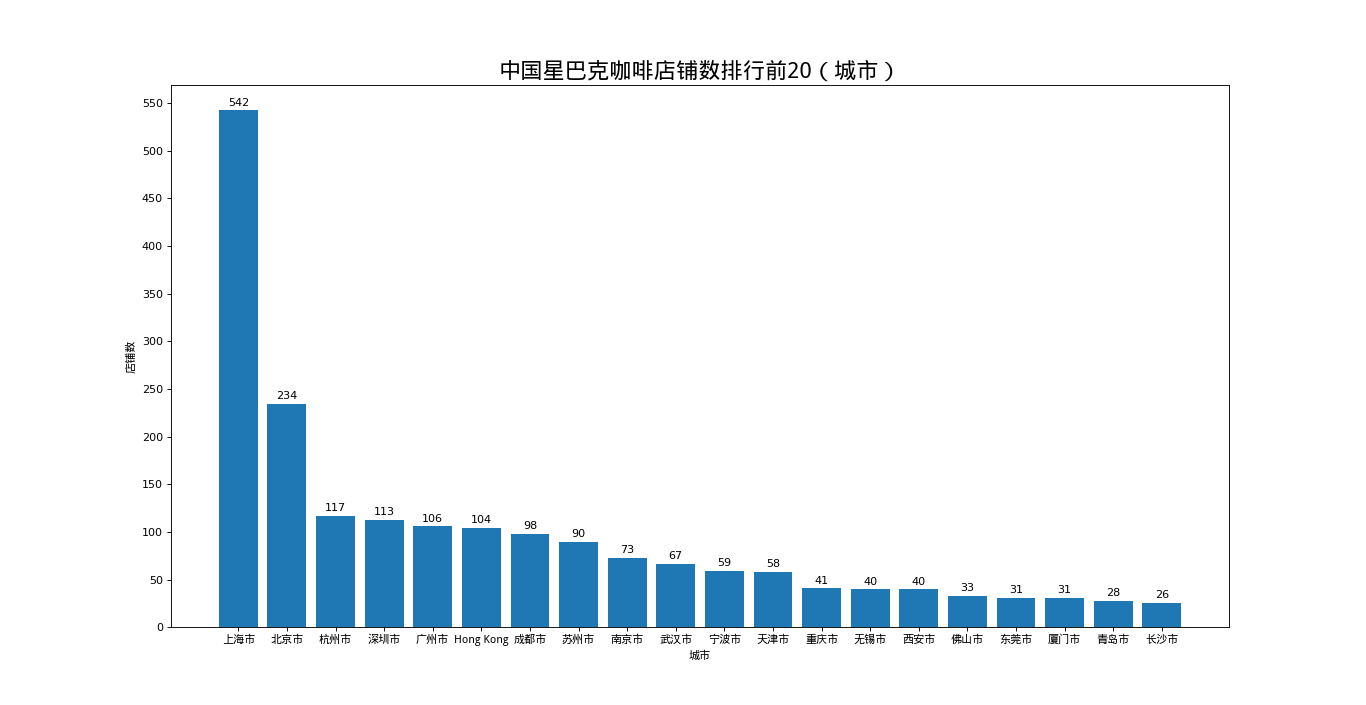
中国店铺数排名前20的城市
# coding=utf-8
# 统计中国店铺数排名前20的城市
import pandas as pd
from matplotlib import pyplot as plt
from matplotlib import font_manager

font = font_manager.FontProperties(fname="/usr/share/fonts/truetype/wqy/wqy-microhei.ttc")
file_path = "./starbucks_store_worldwide.csv"
df = pd.read_csv(file_path)

# 处理数据
df = df[df["Country"] == "CN"]
data1 = df.groupby(by="City").count().sort_values(by="Brand", ascending=False)[:20]["Brand"]
_x = list(data1.index)
_y = list(data1.values)

# 画图
plt.figure(figsize=(20,8), dpi=80)

plt.bar(range(len(_x)), _y)
# 添加条形图数值
for xx, yy in zip(range(len(_x)),_y):
    plt.text(xx, yy+5, str(yy), ha='center')

plt.xticks(range(len(_x)), _x, fontproperties=font)
plt.yticks(range(max(_y)+50)[::50])
plt.xlabel("城市", fontproperties=font)
plt.ylabel("店铺数", fontproperties=font)
plt.title("中国星巴克咖啡店铺数排行前20(城市)", fontproperties=font, size=20)

plt.show()
结果如图:
第二组例子(世界排行前10000书籍信息)
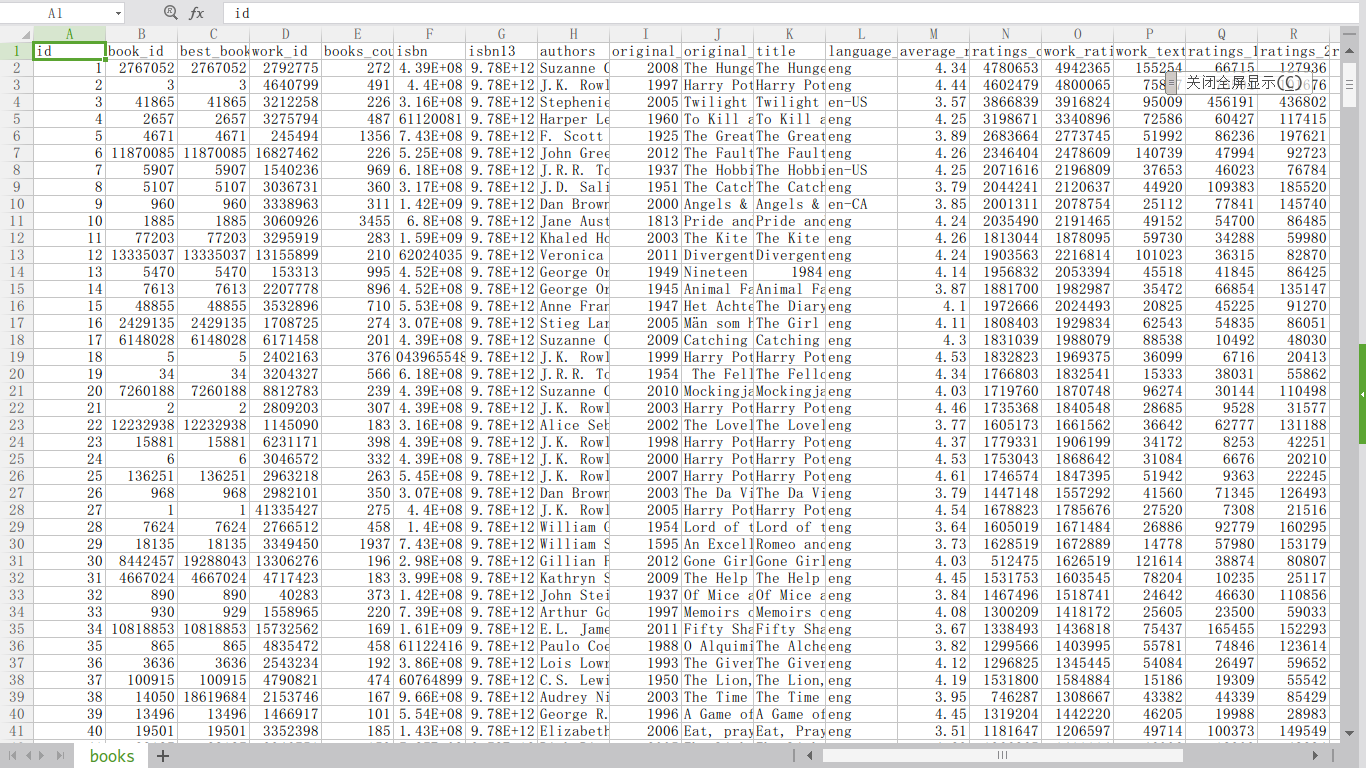
假如我们现在有这样一组数据:世界排行前10000书籍信息,如下图所示。数据来源:books。
各年份书籍平均评分
#  coding=utf-8

import pandas as pd
from matplotlib import pyplot as plt

file_path = "./books.csv"
pd.set_option('display.max_columns', 100)
df = pd.read_csv(file_path)

# 不同年份书籍的平均评分

# 去除NaN
data1 = df[pd.notnull(df["original_publication_year"])]
#
print(type(data1))
grouped = data1["average_rating"].groupby(by=data1["original_publication_year"]).mean()

print(grouped)

_x = grouped.index
_y = grouped.values

plt.figure(figsize=(20, 8), dpi=80)


plt.plot(range(len(_x)), _y)

plt.xticks(range(len(_x))[::15], _x[::15].astype(int), rotation=45)
plt.grid()
plt.show()
结果如图:
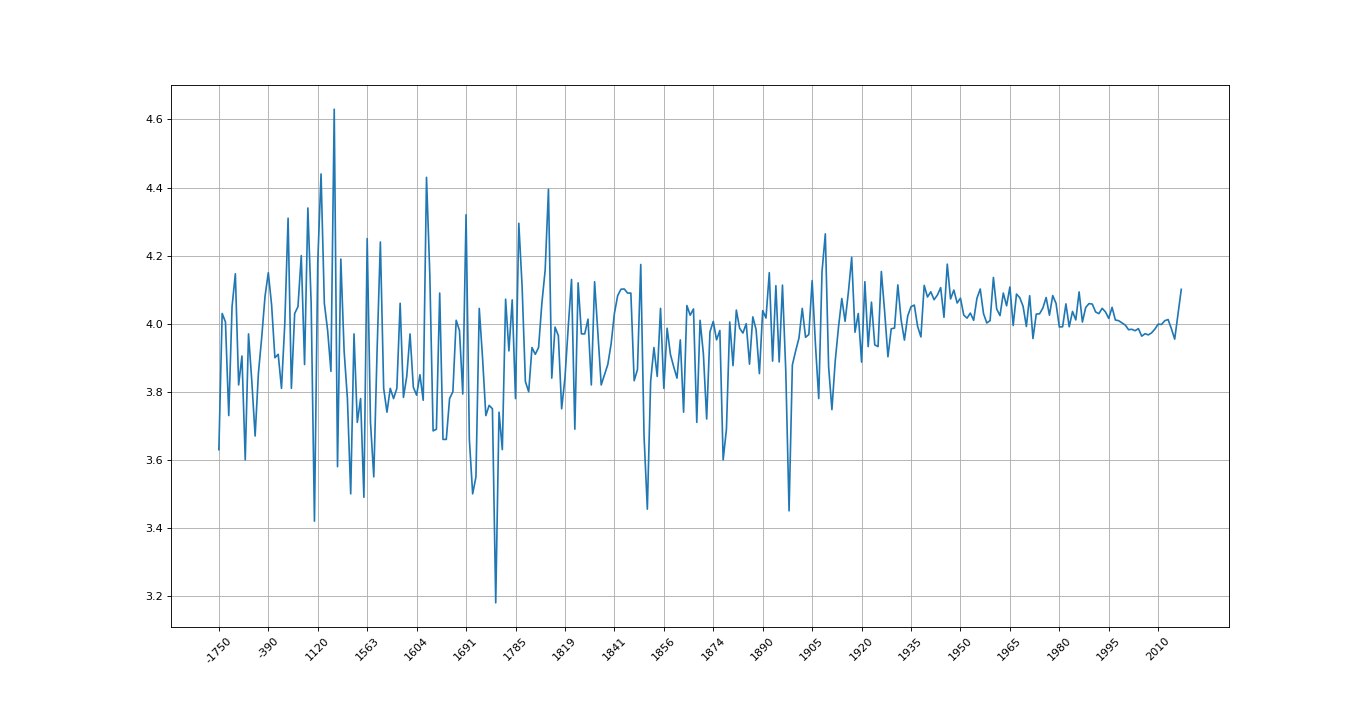
由于公元前的年份书籍较少,每年只有一本,所以数据波动幅度会很大,越往后就会越趋于平稳
911紧急求救电话信息
这个案例不牵扯绘图,但是这个案例中有个很重要的问题就是关于对数据进行遍历的问题。数据来源:Emergency - 911 Calls
假如我们要读取这个数据文件中各类求救电话的数量,应该怎么做呢?我们首先来看一下这个数据文件的基本信息。
# coding=utf-8

import pandas as pd
import numpy as np

file_path = "./911.csv"
pd.set_option('display.max_columns', 100)
df = pd.read_csv(file_path)

print(df.info())
结果如下:
<class 'pandas.core.frame.DataFrame'>
RangeIndex: 249737 entries, 0 to 249736
Data columns (total 9 columns):
lat          249737 non-null float64
lng          249737 non-null float64
desc         249737 non-null object
zip          219391 non-null float64
title        249737 non-null object
timeStamp    249737 non-null object
twp          249644 non-null object
addr         249737 non-null object
e            249737 non-null int64
dtypes: float64(3), int64(1), object(5)
memory usage: 17.1+ MB
None

Process finished with exit code 0
可以看到这个数据文件竟然有25万行之多- -
我们再查看他的第一行信息:
print(df.head(1))
结果如下:
         lat        lng                                               desc  \
0  40.297876 -75.581294  REINDEER CT & DEAD END;  NEW HANOVER; Station ...

       zip                   title            timeStamp          twp  \
0  19525.0  EMS: BACK PAINS/INJURY  2015-12-10 17:10:52  NEW HANOVER

                     addr  e
0  REINDEER CT & DEAD END  1

Process finished with exit code 0
可以看到类型适合具体事项都归类在了title里面,所以我们第一步首先要将类型和具体事项分隔开:
data1 = df["title"].str.split(": ").tolist()
# 这里我们直接对所得分类做了去重操作
data2 = set([i[0] for i in data1])
下面关键的一步,我们要统计各个分类下的求救电话数量。因为这个数据有25w行,所以如果像我之前的文章中去一行一行的遍历,程序的速度就会变得非常慢。这里我们使用for循环来遍历分类列表,则会快很多。
# 创建全0数组方便下一步的统计
a = pd.DataFrame(np.zeros((df.shape[0], len(data2))), columns=data2, dtype=int)
# 这一步就是将a中与原数据中相同索引行,但title中包含i类型求助信息的那个值置为1
for i in data2:
    a[i][df["title"].str.contains(i)] = 1

a_sum = a.sum(axis=0).sort_values(ascending=False)
print(a_sum)
结果如下:
EMS        124844
Traffic     87465
Fire        37432
dtype: int64

 浙公网安备 33010602011771号