Centos6.5部署Rsyslog+LogAnalyzer收集网络及系统日志
1. 介绍
Rsyslog是比syslog功能更强大的日志记录系统,可以将日志输出到文件,数据库和其它程序.可以使用rsyslog替换系统自带的syslog。
LogAnalyzer 是一个 syslog 和其他网络事件数据的 Web 前端工具,提供简单易用的日志浏览、搜索和基本分析以及图表显示。数据可以从数据库或一般的syslog文本文件中获取,所以LogAnalyzer不需要改变现有的记录架构。基于当前的日志数据,它可以处理syslog日志消息,Windows事件日志记录,支持故障排除,使用户能够快速查找日志数据中看出问题的解决方案。LogAnalyzer 获取客户端日志会有两种保存模式,一种是直接读取客户端/var/log/目录下的日志并保存到服务端该目录下,一种是读取后保存到日志服务器数据库中,推荐使用后者。
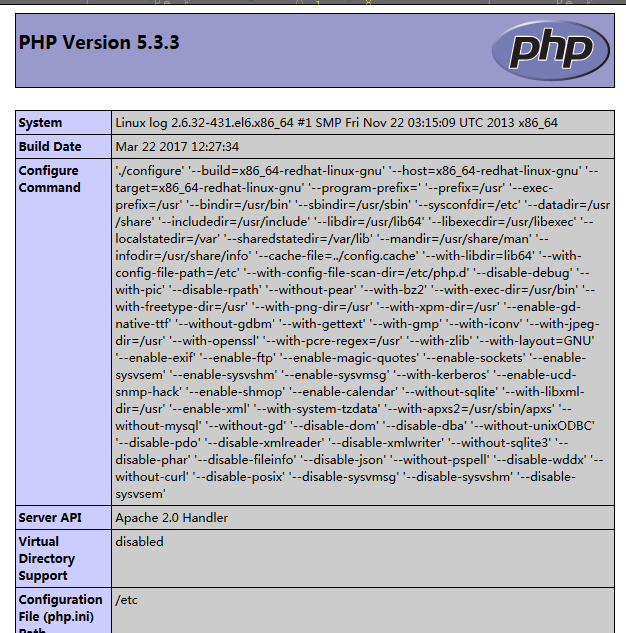
LogAnalyzer 采用php开发,所以日志服务器需要php的运行环境。
2. 系统环境
本文环境为CENTOS 6.5平台部署Rsyslog+LogAnalyzer+LAMP。
rsyslog版本:rsyslog-5.8.10-8.el6.x86_64
loganalyzer版本:loganalyzer-3.6.5,目前最新版本为4.1.6
SELINUX=disabled
iptables开启,放行80,TCP/UDP 514端口
3. 安装环境
安装LAMP以及依赖的环境,我这里选择yum方式,也可以选择源代码编译安装。
[root@log ~]# yum install mysql-server mysql-devel libcurl-devel net-snmp-devel php php-gd php-xml php-mysql httpd -y
设置开机启动
[root@log ~]# /etc/init.d/httpd start
[root@log ~]# /etc/init.d/mysqld start
[root@log ~]# chkconfig mysqld on
[root@log ~]# chkconfig httpd on
[root@log ~]# chkconfig rsyslog on
设置数据库密码
[root@log ~]# mysqladmin -uroot password '123456'
测试PHP
[root@log ~]# cd /var/www/html/
[root@log html]# cat > index.php << EOF
> <?php
> phpinfo();
> ?>
> EOF
LAMP环境配置完毕。
4. 配置服务器端
4.1. 检查并安装服务器端软件
[root@log ~]# rpm -qa |grep rsyslog
rsyslog-5.8.10-8.el6.x86_64
[root@log ~]# yum install rsyslog-mysql -y
4.2. 导入rsyslog-MySQL数据库文件
[root@log ~]# cd /usr/share/doc/rsyslog-mysql-5.8.10/
[root@log rsyslog-mysql-5.8.10]# mysql -uroot -p123456 < createDB.sql
mysql更改密码时如果有!,那么要加“\”,在shell脚本当中如果出现此问题,加上“\”反转意符号
[root@rsyslog ~]# mysqladmin -uroot -pzhang.coM@!@# password zhang123
-bash: !@#: event not found
[root@rsyslog ~]# mysqladmin -uroot -pzhang.coM@\!@# password zhang123
[root@rsyslog ~]# mysql -uroot -p #登录测试
查看操作是否生效
[root@log ~]# mysql -uroot -p
Enter password:
Welcome to the MySQL monitor. Commands end with ; or \g.
Your MySQL connection id is 5
Server version: 5.1.73 Source distribution
Copyright (c) 2000, 2013, Oracle and/or its affiliates. All rights reserved.
Oracle is a registered trademark of Oracle Corporation and/or its
affiliates. Other names may be trademarks of their respective
owners.
Type 'help;' or '\h' for help. Type '\c' to clear the current input statement.
导入数据库操作创建了Syslog 库并在该库中创建了两张空表SystemEvents 和SystemEventsProperties。
mysql> show databases;
+--------------------+
| Database |
+--------------------+
| information_schema |
| Syslog |
| mysql |
| test |
+--------------------+
4 rows in set (0.00 sec)
mysql> use Syslog
Reading table information for completion of table and column names
You can turn off this feature to get a quicker startup with -A
Database changed
mysql> show tables;
+------------------------+
| Tables_in_Syslog |
+------------------------+
| SystemEvents |
| SystemEventsProperties |
+------------------------+
2 rows in set (0.00 sec)
创建rsyslog 用户在mysql下的相关权限
mysql> grant all on Syslog.* to rsyslog@localhost identified by '123456';
Query OK, 0 rows affected (0.00 sec)
刷新
mysql> flush privileges;
Query OK, 0 rows affected (0.00 sec)
mysql> exit
Bye
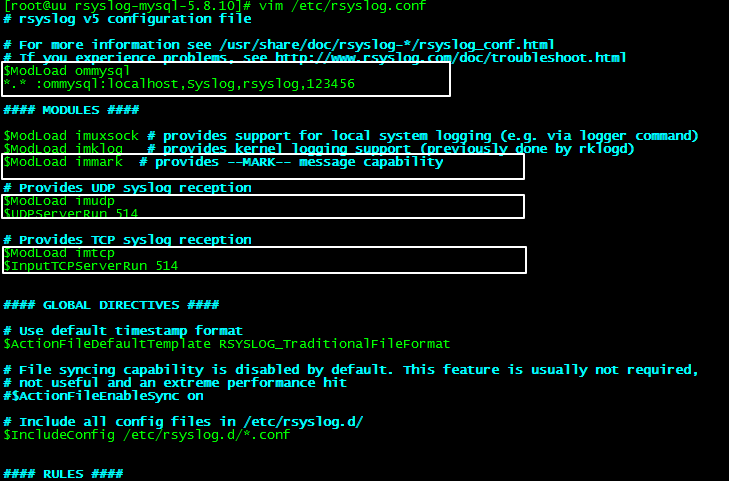
4.3. 设置rsylog.conf
[root@log ~]# vim /etc/rsyslog.conf
配置服务端支持rsyslog-mysql 模块,并开启UDP服务端口获取网内其他LINUX系统日志
(1)在#### MODULES ####上面一行添加
$ModLoad ommysql
*.* :ommysql:localhost,Syslog,rsyslog,123456
注:localhost 表示本地主机,Syslog 为数据库名,rsyslog 为数据库的用户,123456为该用户密码。
(2)开启相关日志模块
支持标记日志
$ModLoad immark
#允许514端口接收使用UDP和TCP协议转发过来的日志
支持udp日志
$ModLoad imudp
$UDPServerRun 514
$ModLoad imtcp
$InputTCPServerRun 514
重启服务
[root@log ~]# /etc/init.d/rsyslog restart
Shutting down system logger: [ OK ]
Starting system logger: [ OK ]
4.4. 放行端口
[root@log ~]# /sbin/iptables -I INPUT -p tcp --dport 80 -j ACCEPT
[root@log ~]#/sbin/iptables -I INPUT -p tcp --dport 514 -j ACCEPT
[root@log ~]#/sbin/iptables -I INPUT -p udp --dport 514 -j ACCEPT
最好是放在配置文件中,要不然系统或者防火墙重启后会失效
# vim /etc/sysconfig/iptables
-A INPUT -m state --state NEW -m tcp -p tcp --dport 514 -j ACCEPT
-A INPUT -m state --state NEW -m udp -p udp --dport 514 -j ACCEPT
# /etc/init.d/iptables restart
5. 客户端
5.1. Linux主机
[root@pstation ~]# ping 192.168.1.1
PING 192.168.1.1 (192.168.1.1) 56(84) bytes of data.
64 bytes from 192.168.1.1: icmp_seq=1 ttl=64 time=1.58 ms
64 bytes from 192.168.1.1: icmp_seq=2 ttl=64 time=0.351 ms
^C
--- 192.168.1.1 ping statistics ---
2 packets transmitted, 2 received, 0% packet loss, time 1357ms
rtt min/avg/max/mdev = 0.351/0.967/1.583/0.616 ms
[root@pstation ~]# rpm -qa | grep rsyslog
rsyslog-5.8.10-10.el6_6.x86_64
编辑配置文件,shift+G到最后一行,按小o,添加如下内容
将系统日志发送到日志服务器。注意@前有空格
[root@pstation ~]# vim /etc/rsyslog.conf
#send syslog to LogServer
*.* @192.168.1.1
[root@pstation ~]# /etc/init.d/rsyslog restart
Shutting down system logger: [ OK ]
Starting system logger: [ OK ]
编辑/etc/bashrc,客户端执行的所有命令写入系统日志/var/log/messages中。
shift+G到最后一行,添加如下内容
[root@pstation ~]# vim /etc/bashrc
export PROMPT_COMMAND='{ msg=$(history 1 | { read x y; echo $y; });logger "[euid=$(whoami)]":$(who am i):[`pwd`]"$msg"; }'
使之生效
[root@pstation ~]# source /etc/bashrc
5.2. 测试是否服务正常
客户端
[root@pstation ~]# ll
total 40
-rw-------. 1 root root 1001 Jan 17 07:17 anaconda-ks.cfg
-rw-r--r--. 1 root root 22430 Jan 17 07:17 install.log
-rw-r--r--. 1 root root 5890 Jan 17 07:15 install.log.syslog
[root@pstation ~]# mkdir /zhang
[root@pstation ~]# cd /zhang/
[root@pstation zhang]# touch test.txt
[root@pstation zhang]# ll
total 0
-rw-r--r--. 1 root root 0 Apr 20 13:05 test.txt
服务端查看
[root@log ~]# tailf /var/log/messages(实时查看)
或
[root@log ~]# tail -10 /var/log/messages
Apr 20 12:21:31 log rsyslogd: -- MARK --
Apr 20 12:41:31 log rsyslogd: -- MARK --
Apr 20 13:01:06 pstation kernel: imklog 5.8.10, log source = /proc/kmsg started.
Apr 20 13:01:06 pstation rsyslogd: [origin software="rsyslogd" swVersion="5.8.10" x-pid="26902" x-info="http://www.rsyslog.com"] start
Apr 20 13:05:16 pstation root: [euid=root]:root pts/0 Apr 20 12:56 (192.168.1.197):[/root]source /etc/bashrc
Apr 20 13:05:34 pstation root: [euid=root]:root pts/0 Apr 20 12:56 (192.168.1.197):[/root]ll
Apr 20 13:05:47 pstation root: [euid=root]:root pts/0 Apr 20 12:56 (192.168.1.197):[/root]mkdir /zhang
Apr 20 13:05:49 pstation root: [euid=root]:root pts/0 Apr 20 12:56 (192.168.1.197):[/zhang]cd /zhang/
Apr 20 13:05:56 pstation root: [euid=root]:root pts/0 Apr 20 12:56 (192.168.1.197):[/zhang]touch test.txt
Apr 20 13:06:00 pstation root: [euid=root]:root pts/0 Apr 20 12:56 (192.168.1.197):[/zhang]ll
5.3. 网络设备
配置NE40/NE80路由器的日志发送功能
默认情况下,NE40/NE80路由器上记录、发送日志的功能是关闭的,要想使日志采集器能够收集到NE40/NE80路由器的日志,必须配置NE40/NE80,将日志发往日志采集器。
前提条件
NE40路由器的时区和时间都必须和eSight服务器保持一致。
操作步骤
配置Syslog日志发送功能。
进入系统视图。
<NE40/NE80> system-view
开启信息中心。
[NE40/NE80] info-center enable
配置允许输出所有模块、严重级别为informational的日志信息。
[NE40/NE80] info-center source default channel 2 log level informational
配置发送日志信息的源接口。
[NE40/NE80] info-center loghost source { interface-type interface-number }
配置日志采集器的IP地址,使NE40/NE80路由器将Syslog日志发送到指定的日志主机。
[NE40/NE80] info-center loghost host-ip-address facility local2 language english
配置会话日志发送功能。
说明:
NAT板、主控板不能往外发送NAT日志,需要通过其他板转发,请在其他板转发日志的端口连上网线,配置IP地址。
进入系统视图。
<NE40/NE80> system-view
启用NAT日志的记录功能。
[NE40/NE80] ip userlog nat export slot slot-id [ host host 9002 | source source-address ] *
该操作将指定槽位号的NAT日志发送到主机。eSight将日志以IP报文格式实时发送到日志服务器的相应端口,并可以指定日志的源地址。要使日志正确地送到日志主机,需要有到日志主机的可达的路由,并且在日志主机上做相应配置。
source-address指定了发送日志报文的源地址,通常使用本地的Loopback接口的地址。
NAT板上的以太网接口是专门用于NAT日志发送的接口,不能配置其他业务。NAT日志也可以通过其他的业务接口发送。
说明:
NE40/NE80的NAT日志以二进制日志形式发送,9002为日志采集器接收二进制日志所用的端口,请不要修改。
保存配置。
[NE40/NE80] quit
<NE40/NE80> save
举例
<huawei>sys
Enter system view, return user view with Ctrl+Z.
[huawei]info-ce
[huawei]info-center en
[huawei]info-center enable
Info: Information center is enabled.
控制台( Console )、日志缓冲区(logbuf )、日志主机( loghost )、监视终端( monitor )SNMP六个方向的日志输出、告警缓冲区(trapbuf)。
[huawei]info-center source default channel ?
INTEGER<0-9> Information channel number
channel6 6 channel's name is channel6
channel7 7 channel's name is channel7
channel8 8 channel's name is channel8
channel9 9 channel's name is channel9
console 0 channel's name is console
logbuffer 4 channel's name is logbuffer
loghost 2 channel's name is loghost
monitor 1 channel's name is monitor
snmpagent 5 channel's name is snmpagent
trapbuffer 3 channel's name is trapbuffer
日志级别即日志的level: local0~local7 16~23保留为本地使用
[huawei]info-center source default channel 2 log level ?
alert Immediate action needed (severity=1) 必须马上采取行动来纠正的事件
critical Critical conditions (severity=2) 关键的事件,大多为关键错误
debugging Debugging messages (severity=7) 调试信息
emergencies System is unusable (severity=0) 系统不可用,极其紧急
error Error conditions (severity=3) 错误事件,需要但不需要太多关注
informational Informational messages (severity=6) 一般的信息,大多为有用的信息
notification Normal but significant conditions (severity=5) 需要注意的信息
warning Warning conditions (severity=4) 警告事件,可能存在某种差错
[huawei]info-center source default channel 2 log level informational
从哪个接口出去
[huawei]info-center loghost source ?
Eth-Trunk Ethernet-Trunk interface
Ethernet Ethernet interface
GigabitEthernet GigabitEthernet interface
LoopBack LoopBack interface
NULL NULL interface
Vlanif Vlan interface
XGigabitEthernet XGigabitEthernet interface
[huawei]info-center loghost source Vlanif 111
目前,系统对每个输出方向缺省分配一个信息通道
输出方向 信息通道号 缺省的信息通道名
控制台 0 console
监视终端 1 monitor
日志主机 2 loghost
告警缓冲区 3 trapbuffer
日志缓冲区 4 logbuffer
snmp 5 snmpagent
[huawei]info-center loghost 192.168.1.1 facility local?
local0 local1
local2 local3
local4 local5
local6 local7
[huawei]info-center loghost 192.168.1.1 facility local2 language English
Warning: There is security risk as this operation enables a non secure syslog protocol.
[huawei]
配置文件
Quitway:

info-center enable
info-center source default channel 2 log level informational
info-center loghost source  GigabitEthernet 2/0/0
info-center loghost 192.168.1.1 local-time facility local2 language  English
################################################################

################################################################
H3C
info-center enable
info-center source default channel loghost log level informational state on
info-center loghost source  Ethernet4/0/0
info-center loghost 192.168.1.1  facility local2
服务端
这个地方有点问题,就是华为的设备默认是发送utc时间的,所以日主主机收到的时间是北京时间-08:00个小时:Apr 27 08:12:14 huawei;
若华为设备发送local-time的话,日志主机解析时会在包前增加一个时间戳,由于loganalyzer默认取第二个字段为主机名,这时候就会出现用Apr为主机名的现象:
Apr 27 16:12:44 Apr 27 2018 16:12:44+08:00 huawei
[root@log ~]# tail -10 /var/log/messages
Apr 20 13:05:16 pstation root: [euid=root]:root pts/0 Apr 20 12:56 (192.168.1.197):[/root]source /etc/bashrc
Apr 20 13:05:34 pstation root: [euid=root]:root pts/0 Apr 20 12:56 (192.168.1.197):[/root]ll
Apr 20 13:05:47 pstation root: [euid=root]:root pts/0 Apr 20 12:56 (192.168.1.197):[/root]mkdir /zhang
Apr 20 13:05:49 pstation root: [euid=root]:root pts/0 Apr 20 12:56 (192.168.1.197):[/zhang]cd /zhang/
Apr 20 13:05:56 pstation root: [euid=root]:root pts/0 Apr 20 12:56 (192.168.1.197):[/zhang]touch test.txt
Apr 20 13:06:00 pstation root: [euid=root]:root pts/0 Apr 20 12:56 (192.168.1.197):[/zhang]ll
Apr 20 05:18:21 huawei %%01SHELL/5/CMDRECORD(s)[0]: Recorded command information. (Task=VT0, Ip=192.168.1.197, VpnName=, User=petrochina, AuthenticationMethod="Local-user", Command="info-center loghost 192.168.1.1 facility local2 language English")
Apr 20 05:18:28 huawei DS/4/DATASYNC_CFGCHANGE: OID 1.3.6.1.4.1.2011.5.25.191.3.1 configurations have been changed. The current change number is 176, the change loop count is 0, and the maximum number of records is 4095.
Apr 20 05:18:41 huawei %%01SECE/4/ARPMISS(l)[1]: Attack occurred.(AttackType=Arp Miss Attack, SourceInterface=GigabitEthernet2/1/0/18, SourceIP=192.168.15.242, AttackPackets=54 packets per second)
Apr 20 05:18:41 huawei SECE/4/ARPMISS_SIP_SPEEDLIMIT_ALARM: OID 1.3.6.1.4.1.2011.5.25.165.2.2.2.12 The arp-miss packet speed with source ip 192.168.15.242 exceed the speed-limit value configed 30.
[root@log ~]# tail -10 /var/log/messages
Apr 20 05:18:41 huawei SECE/4/ARPMISS_SIP_SPEEDLIMIT_ALARM: OID 1.3.6.1.4.1.2011.5.25.165.2.2.2.12 The arp-miss packet speed with source ip 192.168.15.242 exceed the speed-limit value configed 30.
Apr 20 05:19:06 huawei ARP/4/ARP_IPCONFLICT_TRAP: OID 1.3.6.1.4.1.2011.5.25.123.2.6 ARP detects IP conflict. (IP address=192.168.13.223, Local interface=Eth-Trunk11, Local MAC=f0de-f1b4-b74a, Local vlan=113, Local CE vlan=0, Receive interface=Eth-Trunk11, Receive MAC=a8b1-d4fb-7ad7, Receive vlan=113, Receive CE vlan=0, IP conflict type=Remote IP conflict).
Apr 20 05:19:06 huawei %%01ARP/4/ARP_LOG_DUPLICATE_IPADDR_DETECT(l)[2]: Detected an IP address collision. (IpAddress=192.168.13.223, LocalMacAddress=f0de-f1b4-b74a, LocalInterfaceName=Eth-Trunk11, LocalVlanId=113, ReceiveMacAddress=a8b1-d4fb-7ad7, ReceiveInterfaceName=Eth-Trunk11, ReceiveVlanId=113)
Apr 20 05:20:20 huawei %%01NTP/4/PEER_SELE(l)[3]: The peer selected by the system is 10.33.176.67.
Apr 20 05:20:26 huawei %%01SECE/6/PORT_ATTACK_END(l)[4]: Auto port-defend stop.(SourceAttackInterface=GigabitEthernet2/1/0/10, AttackProtocol=ARP-REQUEST)
Apr 20 05:20:50 huawei %%01MSTP/6/RECEIVE_MSTITC(l)[5]: MSTP received BPDU with TC, MSTP process 0 instance 0, port name is Eth-Trunk7.
Apr 20 05:20:59 huawei %%01SNMP/4/SNMP_FAIL(s)[6]: Failed to login through SNMP. (Ip=192.168.11.137, Times=6, Reason=the version was incorrect, VPN= )
Apr 20 05:22:23 huawei %%01INFO/4/SUPPRESS_LOG(l)[7]: Last message repeated 9 times.(InfoID=1082212355, ModuleName=SNMP, InfoAlias=SNMP_FAIL)
Apr 20 05:22:23 huawei %%01DEFD/6/CPCAR_DROP_LPU(l)[8]: Rate of packets to cpu exceeded the CPCAR limit on the LPU in slot 2/1. (Protocol=arp-reply, CIR/CBS=64/10000, ExceededPacketCount=65)
Apr 20 05:22:23 huawei %%01DEFD/6/CPCAR_DROP_LPU(l)[9]: Rate of packets to cpu exceeded the CPCAR limit on the LPU in slot 2/1. (Protocol=arp-miss, CIR/CBS=64/10000, ExceededPacketCount=141)
6.LogAnalyzer
6.1. 下载与安装
如无法下载可以去http://loganalyzer.adiscon.com/downloads/下载。
[root@log app]wget http://download.adiscon.com/loganalyzer/loganalyzer-3.6.5.tar.gz
[root@log app]# tar zxvf loganalyzer-3.6.5.tar.gz
[root@log app]# cd loganalyzer-3.6.5
[root@log loganalyzer-3.6.5]# mkdir -p /var/www/html/loganalyzer
[root@log loganalyzer-3.6.5]# rsync -a src/* /var/www/html/loganalyzer/
[root@log loganalyzer-3.6.5]# cd /var/www/html/loganalyzer/
[root@log loganalyzer]# ll
total 256
drwxrwxr-x. 2 root root 4096 Oct 9 2013 BitstreamVeraFonts
drwxrwxr-x. 2 root root 4096 Oct 9 2013 admin
-rw-rw-r--. 1 root root 5509 Oct 9 2013 asktheoracle.php
-rw-rw-r--. 1 root root 18492 Oct 9 2013 chartgenerator.php
drwxrwxr-x. 6 root root 4096 Oct 9 2013 classes
-rw-rw-r--. 1 root root 9205 Oct 9 2013 convert.php
drwxrwxr-x. 2 root root 4096 Oct 9 2013 cron
drwxrwxr-x. 2 root root 4096 Oct 9 2013 css
-rw-rw-r--. 1 root root 16499 Oct 9 2013 details.php
drwxr-xr-x. 2 root root 4096 Oct 9 2013 doc
-rw-rw-r--. 1 root root 12748 Oct 9 2013 export.php
-rw-rw-r--. 1 root root 1150 Oct 9 2013 favicon.ico
drwxrwxr-x. 5 root root 4096 Oct 9 2013 images
drwxrwxr-x. 2 root root 4096 Oct 9 2013 include
-rw-rw-r--. 1 root root 38383 Oct 9 2013 index.php
-rw-rw-r--. 1 root root 41586 Oct 9 2013 install.php
drwxrwxr-x. 2 root root 4096 Oct 9 2013 js
drwxrwxr-x. 4 root root 4096 Oct 9 2013 lang
-rw-rw-r--. 1 root root 3395 Oct 9 2013 login.php
-rw-rw-r--. 1 root root 7164 Oct 9 2013 reportgenerator.php
-rw-rw-r--. 1 root root 4146 Oct 9 2013 reports.php
-rw-rw-r--. 1 root root 9438 Oct 9 2013 search.php
-rw-rw-r--. 1 root root 4878 Oct 9 2013 statistics.php
drwxrwxr-x. 3 root root 4096 Oct 9 2013 templates
drwxrwxr-x. 4 root root 4096 Oct 9 2013 themes
-rw-rw-r--. 1 root root 3383 Oct 9 2013 userchange.php
6.2. 配置
在浏览器中输入http://x.x.x.x/loganalyzer
提示没有配置文件,点击 here 利用向导生成。

Step 1 - Prerequisites
Before you start installing LogAnalyzer, the Installer setup has to check a few things first.
You may have to correct some file permissions first.

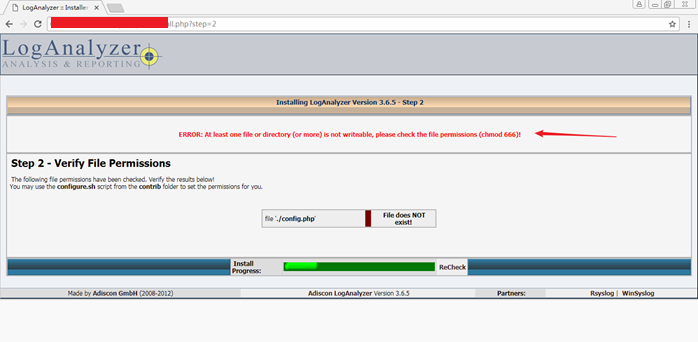
Step 2 - Verify File Permissions
The following file permissions have been checked. Verify the results below!
You may use the configure.sh script from the contrib folder to set the permissions for you.
提示错误:config.php 文件不存在,并且权限要设置为666,可以使用contrib目录下的configure.sh 脚本生成。
[root@log loganalyzer]# cd /zhang/app/loganalyzer-3.6.5
[root@log loganalyzer-3.6.5]# ll
total 104
-rw-rw-r--. 1 root root 35497 Oct 9 2013 COPYING
-rw-rw-r--. 1 root root 44027 Oct 9 2013 ChangeLog
-rw-rw-r--. 1 root root 8449 Oct 9 2013 INSTALL
drwxrwxr-x. 2 root root 4096 Oct 9 2013 contrib
drwxrwxr-x. 2 root root 4096 Oct 9 2013 doc
drwxrwxr-x. 14 root root 4096 Oct 9 2013 src
[root@log loganalyzer-3.6.5]# cd contrib/
[root@log contrib]# ll
total 8
-rw-rw-r--. 1 root root 49 Oct 9 2013 configure.sh
-rw-rw-r--. 1 root root 31 Oct 9 2013 secure.sh
查看configure.sh,提示说要创建config.php,并给666的权限。
[root@log contrib]# cat configure.sh
#!/bin/sh
touch config.php
chmod 666 config.php
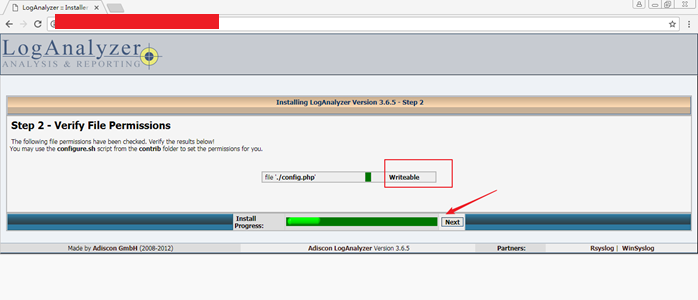
[root@log contrib]# cd /var/www/html/loganalyzer/
[root@log loganalyzer]# touch config.php
[root@log loganalyzer]# chmod 666 config.php
[root@log loganalyzer]# vim /etc/rsyslog.conf
刷新web或下端的recheck
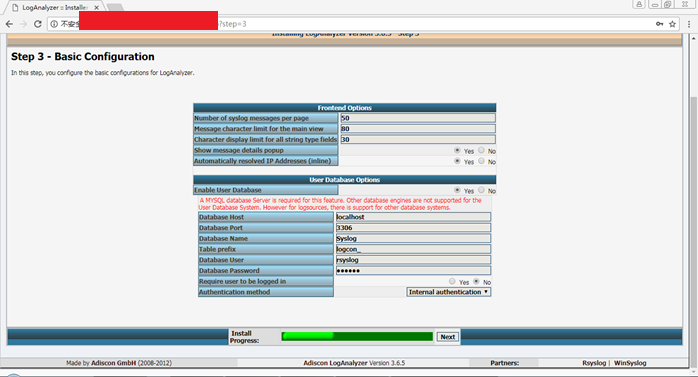
Step 3 - Basic Configuration
In this step, you configure the basic configurations for LogAnalyzer.
将User Database Options下Enable User Database ===>Yes
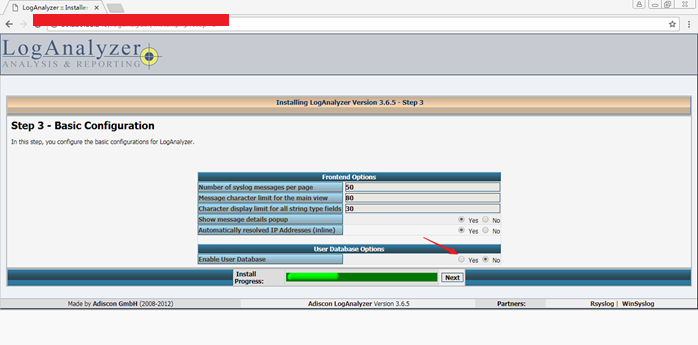
填写下面三项
|
Database Name |
|
|
Database User |
|
|
Database Password |

Step 4 - Create Tables
If you reached this step, the database connection has been successfully verified!
The next step will be to create the necessary database tables used by the LogAnalyzer User System. This might take a while!
WARNING, if you have an existing LogAnalyzer installation in this database with the same tableprefix, all your data will be OVERWRITTEN! Make sure you are using a fresh database, or you want to overwrite your old LogAnalyzer database.

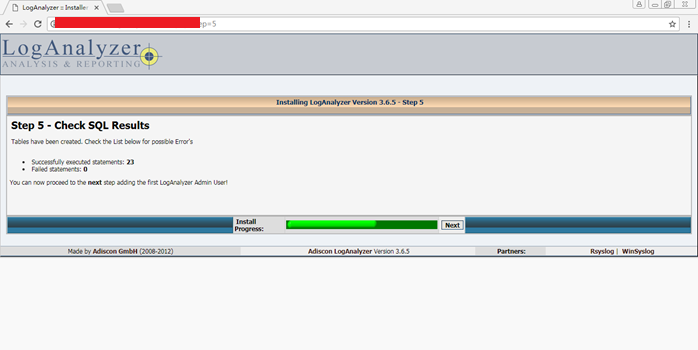
Step 5 - Check SQL Results检测结果
Successfully executed statements: 23
Failed statements: 0
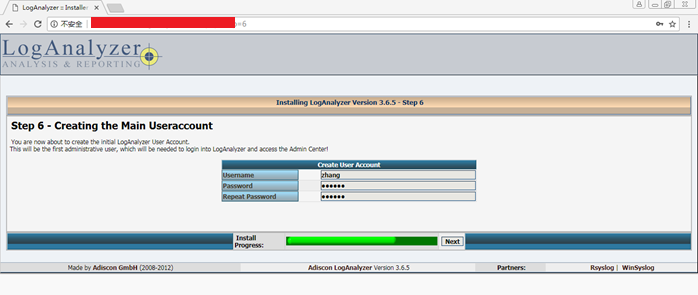
Step 6 - Creating the Main Useraccount
You are now about to create the initial LogAnalyzer User Account.
This will be the first administrative user, which will be needed to login into LogAnalyzer and access the Admin Center!
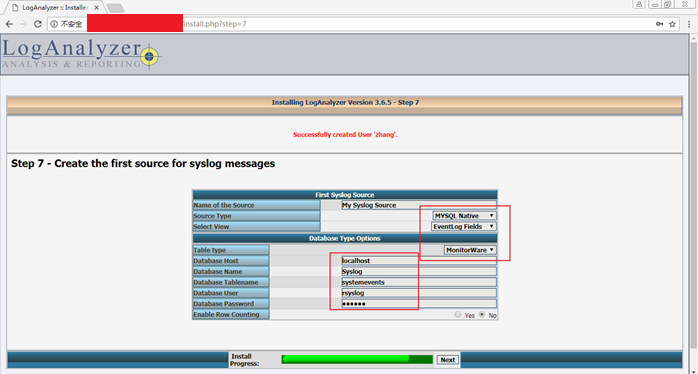
Step 7 - Create the first source for syslog messages
Database Tablename:SystemEvents
正确填写以上信息,注意大小写,SystemEvents大小写一定要留神,否则会出错(1)。
错误的:
Step 8 - Done
继续下一步就会提示成功啦
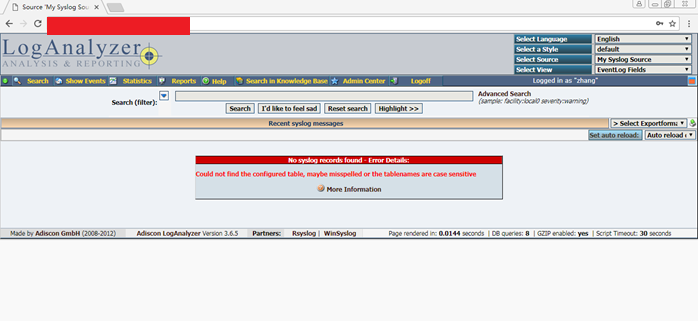
完成后发现出错,回头检查发现第7步出问题(1)了,


 浙公网安备 33010602011771号