elasticsearch 组件基于单机的多实例集群
声明:
本示例主要作为测试用,生产请慎重。
最近公司突发奇想,想让我们搞个单机多实例的 es 的集群,看看其性能咋样。通常来说,es 作为搜索引擎,应用场景不乏日志分析、网络安全、搜索引擎等,有时也会用作日志数据库使用,毕竟其出色的搜索查询性能,不是同等量级 关系型数据库可以比拟的,主要还是因为其 倒排索引 的特殊性,这里不讨论 倒排索引 与 B+ Tree 的性能,我们主要看看这种集群怎么组建的。
环境
环境准备:
- ubuntu,24核,64G
- docker 20.10.2
因为是 es 集群,我们准备通过 docker 来创建实例,所以之前你还得先 pull es、kibana 的 image:
docker pull elasticsearch:6.8.23
docker pull kibana:6.8.23
相关配置
如果你的容器有限,可以直接通过脚本运行 docker run,但是如果容器数量多还有相关依赖,建议通过 容器编排 起容器,当然数量更大的情况下,建议通过 k8s 部署。
我们的集群主要包含 3 个 es 节点,外加一个 kibana 作为观测,所以通过 docker-compose 作为容器编排,相对合适。
接下来是我们的编排定义:
docker-compose.yml
version: "2.3"
services:
  es-0:
    image: elasticsearch:6.8.23
    hostname: es-0
    container_name: es-0
    environment:
      - bootstrap.memory_lock=true
    ulimits:
      memlock:
        soft: -1
        hard: -1
    cap_add:
      - IPC_LOCK
    volumes:
      - /var/xxx/es_cluster/es-0:/usr/share/elasticsearch/data # 容器数据映射
      - ./es_cluster/es-0/elasticsearch:/etc/default/elasticsearch # elasticsearch 文件映射
      - ./es_cluster/es-0/config:/usr/share/elasticsearch/config # 配置映射,主要是 elasticsearch.yaml 和 jvm.options
      - /var/log/es_cluster/es-0/logs:/usr/share/elasticsearch/logs # 日志映射
      - /usr/share/zoneinfo/Asia/Shanghai:/etc/localtime # 时间
      - /etc/timezone:/etc/timezone
      #- ./elasticsearch/jvm.options:/etc/elasticsearch/jvm.options
    ports:
      - "9200:9200" # 端口映射
    command: elasticsearch
    logging:
      options:
        max-size: "200M"
        max-file: "5"
    networks:
      app_net:
        ipv4_address: 172.238.238.219
    healthcheck:
        test: ["CMD", "curl", "-f", "-s", "http://172.238.238.219:9200/_cluster/health?wait_for_status=yellow&timeout=50s"]
        interval: 30s
        timeout: 10s
        retries: 20
    restart: always

  es-1:
    image: elasticsearch:6.8.23
    hostname: es-1
    container_name: es-1
    environment:
      - bootstrap.memory_lock=true
    ulimits:
      memlock:
        soft: -1
        hard: -1
    cap_add:
      - IPC_LOCK
    volumes:
      - /var/xxx/es_cluster/es-1:/usr/share/elasticsearch/data
      - ./es_cluster/es-1/elasticsearch:/etc/default/elasticsearch
      - ./es_cluster/es-1/config:/usr/share/elasticsearch/config
      - /var/log/es_cluster/es-1/logs:/usr/share/elasticsearch/logs
      - /usr/share/zoneinfo/Asia/Shanghai:/etc/localtime
      - /etc/timezone:/etc/timezone
      #- ./elasticsearch/jvm.options:/etc/elasticsearch/jvm.options
    ports:
      - "9201:9201"
    command: elasticsearch
    logging:
      options:
        max-size: "200M"
        max-file: "5"
    networks:
      app_net:
        ipv4_address: 172.238.238.229
    healthcheck:
      test: ["CMD", "curl", "-f", "-s", "http://172.238.238.229:9200/_cluster/health?wait_for_status=yellow&timeout=50s"]
      interval: 30s
      timeout: 10s
      retries: 20
    restart: always

  es-2:
    image: elasticsearch:6.8.23
    hostname: es-2
    container_name: es-2
    environment:
      - bootstrap.memory_lock=true
    ulimits:
      memlock:
        soft: -1
        hard: -1
    cap_add:
      - IPC_LOCK
    volumes:
      - /var/xxx/es_cluster/es-2:/usr/share/elasticsearch/data
      - ./es_cluster/es-2/elasticsearch:/etc/default/elasticsearch
      - ./es_cluster/es-2/config:/usr/share/elasticsearch/config
      - /var/log/es_cluster/es-2/logs:/usr/share/elasticsearch/logs
      - /usr/share/zoneinfo/Asia/Shanghai:/etc/localtime
      - /etc/timezone:/etc/timezone
      #- ./elasticsearch/jvm.options:/etc/elasticsearch/jvm.options
    ports:
      - "9202:9202"
    command: elasticsearch
    logging:
      options:
        max-size: "200M"
        max-file: "5"
    networks:
      app_net:
        ipv4_address: 172.238.238.239
    healthcheck:
      test: ["CMD", "curl", "-f", "-s", "http://172.238.238.239:9200/_cluster/health?wait_for_status=yellow&timeout=50s"]
      interval: 30s
      timeout: 10s
      retries: 20
    restart: always

  kibana:
    image: kibana:6.8.23
    hostname: kibana
    container_name: kibana
    volumes:
      - ./kibana/kibana.yml:/usr/share/kibana/config/kibana.yml
      - /usr/share/zoneinfo/Asia/Shanghai:/etc/localtime
      - /etc/timezone:/etc/timezone
      - ./kibana/kibana.keystore:/usr/share/kibana/data/kibana.keystore
    ports:
      - "5601:5601"
    networks:
      app_net:
        ipv4_address: 172.238.238.242
    restart: always
    logging:
      options:
        max-size: "200M"
        max-file: "5"

networks:
  app_net:
    driver: bridge
    ipam:
      driver: default
      config:
      - subnet: 172.238.238.0/24
这里限定 docker 的网络网段。
然后我们要看看对应的其他准备。
主要看我们的对应到主机中的 data 目录,所以参考 yml 中的相关映射,注意创建相关目录。
这里我们主要看看相关的 elasticsearch.yaml 和 jvm.options。
elasticsearch.yml
cluster:
  name: logserver
#################
node.name: es-0 # 其他节点类似,修改 node name
discovery.zen.ping.unicast.hosts: ["es-0", "es-1", "es-2"]
network.host: 0.0.0.0
discovery.zen.minimum_master_nodes: 2
gateway.recover_after_nodes: 3
http.port: 9200
transport.tcp.port: 9300
node.master: true
node.data: true

http.host: 0.0.0.0

http:
  enabled: true
  compression: true
  cors:
    enabled: true
    allow-origin: "*"

bootstrap.memory_lock: true
bootstrap.system_call_filter: false
path.data: /usr/share/elasticsearch/data

#cluster.routing.allocation.disk.threshold_enabled: true
#cluster.routing.allocation.disk.watermark.flood_stage: 80gb
#cluster.routing.allocation.disk.watermark.high: 100gb
#cluster.routing.allocation.disk.watermark.low: 120gb


##Lock memory, do not write swap
#bootstrap.mlockall: true
##The cache type is set to Soft Reference,
##and is reclaimed only if there is not enough memory
#index.cache.field.max_size: 50000
#index.cache.field.expire: 10m
#index.cache.field.type: soft
##Weighing the performance of the index and the timeliness of retrieval
#index.translog.flush_threshold_ops: 10000
#index.refresh_interval: 1
#number_of_replicas: 0

#indices.lifecycle.poll_interval: 5m

xpack.ml.enabled: false
jvm.options
...
# Xms represents the initial size of total heap space
# Xmx represents the maximum size of total heap space

-Xms16g # 主机内存64G,每个实例分配16G
-Xmx16g

################################################################
## Expert settings
################################################################
##
...
这两个文件按照上面内容修改。
接下来是 kibana.yml:
...
elasticsearch.url: "http://172.xxx.xxx.xxx:9200" # 根据实际情况,填入自己的主机ip
...
接下来通过 docker-compose 命令就可以起容器了。
docker-compsoe up -d # 后台运行容器

docker-compose ps # 查看容器运行状态

docker-compose down # 停掉容器
结果查看
接下来看看容器状态:
# docker-compose ps
 Name               Command                  State                         Ports
---------------------------------------------------------------------------------------------------
es-0     /usr/local/bin/docker-entr ...   Up (healthy)   0.0.0.0:9200->9200/tcp, 9300/tcp
es-1     /usr/local/bin/docker-entr ...   Up (healthy)   9200/tcp, 0.0.0.0:9201->9201/tcp, 9300/tcp
es-2     /usr/local/bin/docker-entr ...   Up (healthy)   9200/tcp, 0.0.0.0:9202->9202/tcp, 9300/tcp
kibana   /usr/local/bin/kibana-docker     Up             0.0.0.0:5601->5601/tcp
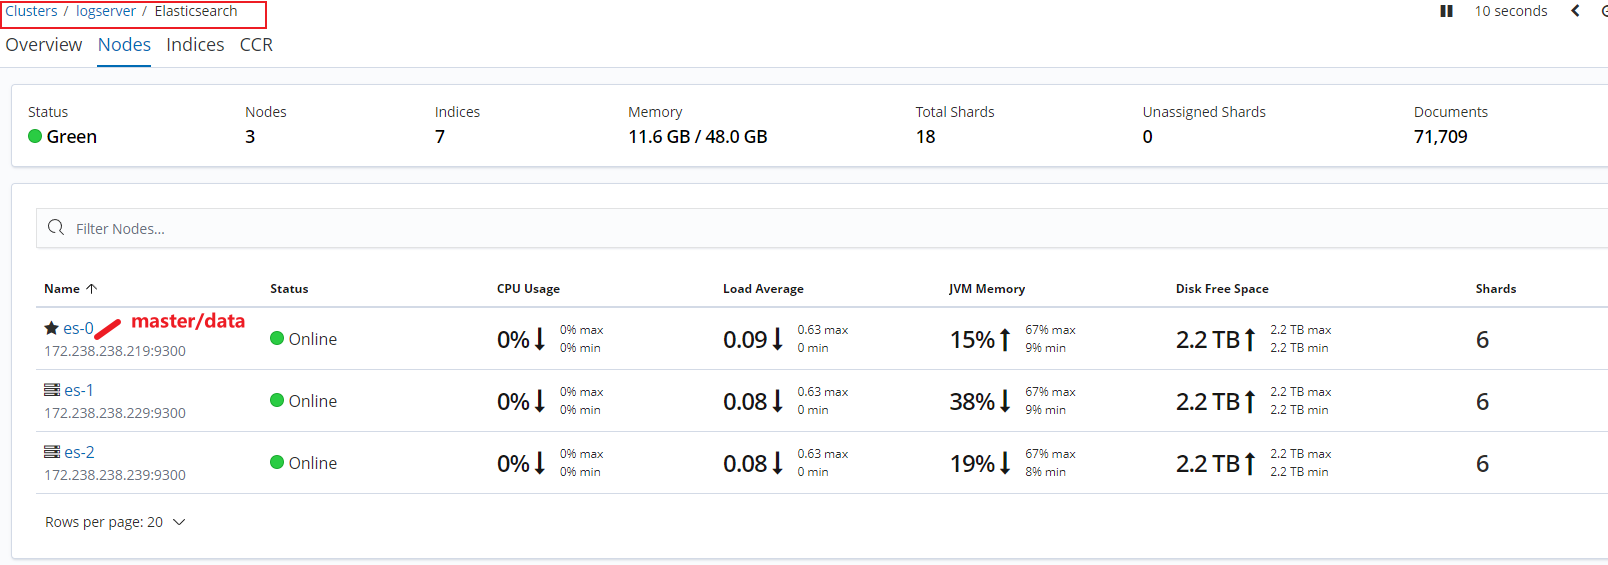
通过 kibana 查看容器状态:
其他看板:
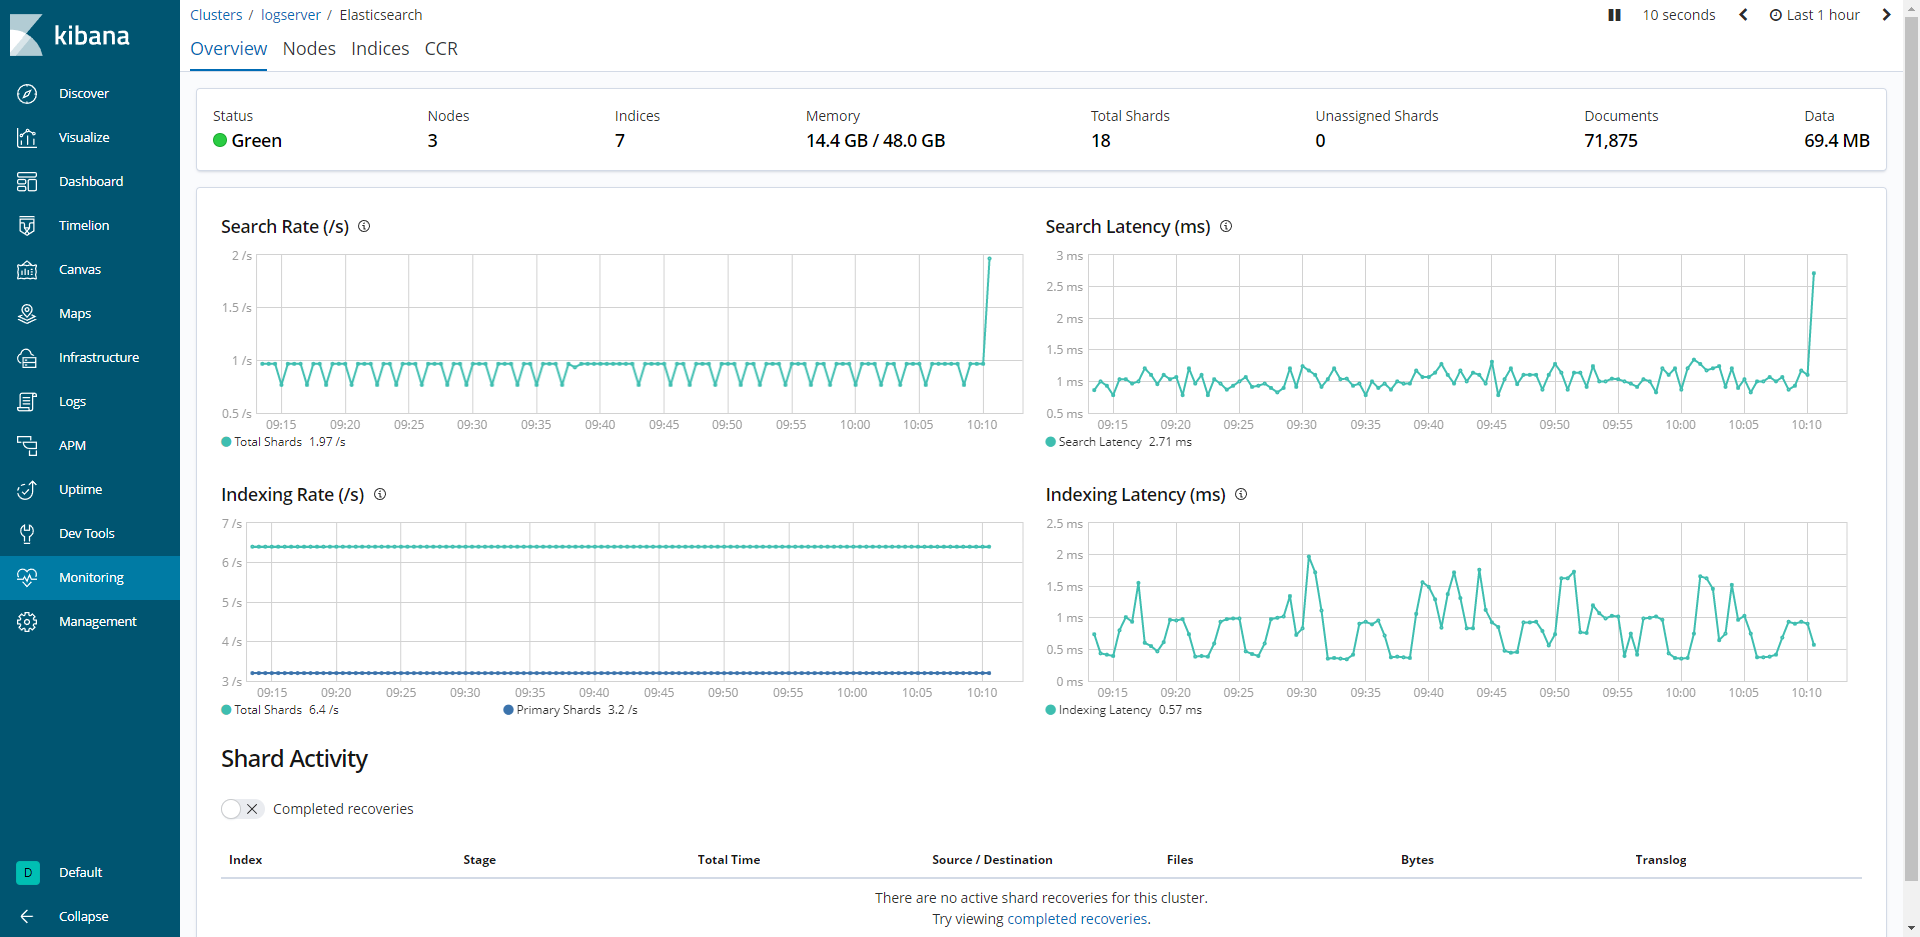
可以看到,es 集群已经顺利起来了,集群实例就演示到这里,希望对你有用。


 浙公网安备 33010602011771号