Golang 大杀器之性能剖析 PProf
参考文章:
接触了那么久的go,一直也在用go写项目代码,有时遇到一些性能、内存问题,一时不好下手,幸好go自带性能大杀器,帮助我们及时知悉项目代码运行情况与cpu耗时、内存占用等一系列问题。
本次分享主要基于 Golang 大杀器之性能剖析 PProf 文档进行学习,感谢文章作者的分享,大家可以根据自己情况学习一波。
1.PProf概述
运用场景
想要进行性能优化,首先瞩目在 Go 自身提供的工具链来作为分析依据,本文将带你学习、使用 Go 后花园,涉及如下:
- runtime/pprof:采集程序(非 Server)的运行数据进行分析
- net/http/pprof:采集 HTTP Server 的运行时数据进行分析
PPro是什么
pprof 是用于可视化和分析性能分析数据的工具
pprof 以 profile.proto 读取分析样本的集合,并生成报告以可视化并帮助分析数据(支持文本和图形报告)
profile.proto 是一个 Protocol Buffer v3 的描述文件,它描述了一组 callstack 和 symbolization 信息, 作用是表示统计分析的一组采样的调用栈,是很常见的 stacktrace 配置文件格式
支持什么使用模式
- Report generation:报告生成
- Interactive terminal use:交互式终端使用
- Web interface:Web 界面
用途
- CPU Profiling:CPU 分析,按照一定的频率采集所监听的应用程序 CPU(含寄存器)的使用情况,可确定应用程序在主动消耗 CPU 周期时花费时间的位置
- Memory Profiling:内存分析,在应用程序进行堆分配时记录堆栈跟踪,用于监视当前和历史内存使用情况,以及检查内存泄漏
- Block Profiling:阻塞分析,记录 goroutine 阻塞等待同步(包括定时器通道)的位置
- Mutex Profiling:互斥锁分析,报告互斥锁的竞争情况
2.demo演示
通过一个简单且有问题的例子,进行本次的程序分析。
相关代码
项目目录:
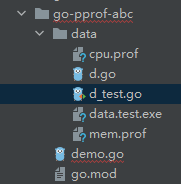
demo.go
package main

import (
	"log"
	"math/rand"
	"net/http"
	_ "net/http/pprof"
	"time"

	"go-pprof-abc/data"
)

func main()  {
	go func() {
		rand.Seed(time.Now().UnixNano())
		for {
			var d int64 = rand.Int63n(3000)
			time.Sleep(time.Duration(d) * time.Millisecond)
			log.Println(data.Add("https://github.com/hahaha"))
		}
	}()

	http.ListenAndServe("0.0.0.0:8080", nil)
}
d.go
package data

var datas []string

func Add(str string) string {
	data := []byte(str)
	sData := string(data)
	datas = append(datas, sData)

	return sData
}
分析
首先运行代码demo.go,我们在浏览器中访问,默认会在/debug/pprofurl中访问。
IDE看运行:
1.通过访问 http://localhost:8080/debug/pprof/
效果如图所示:
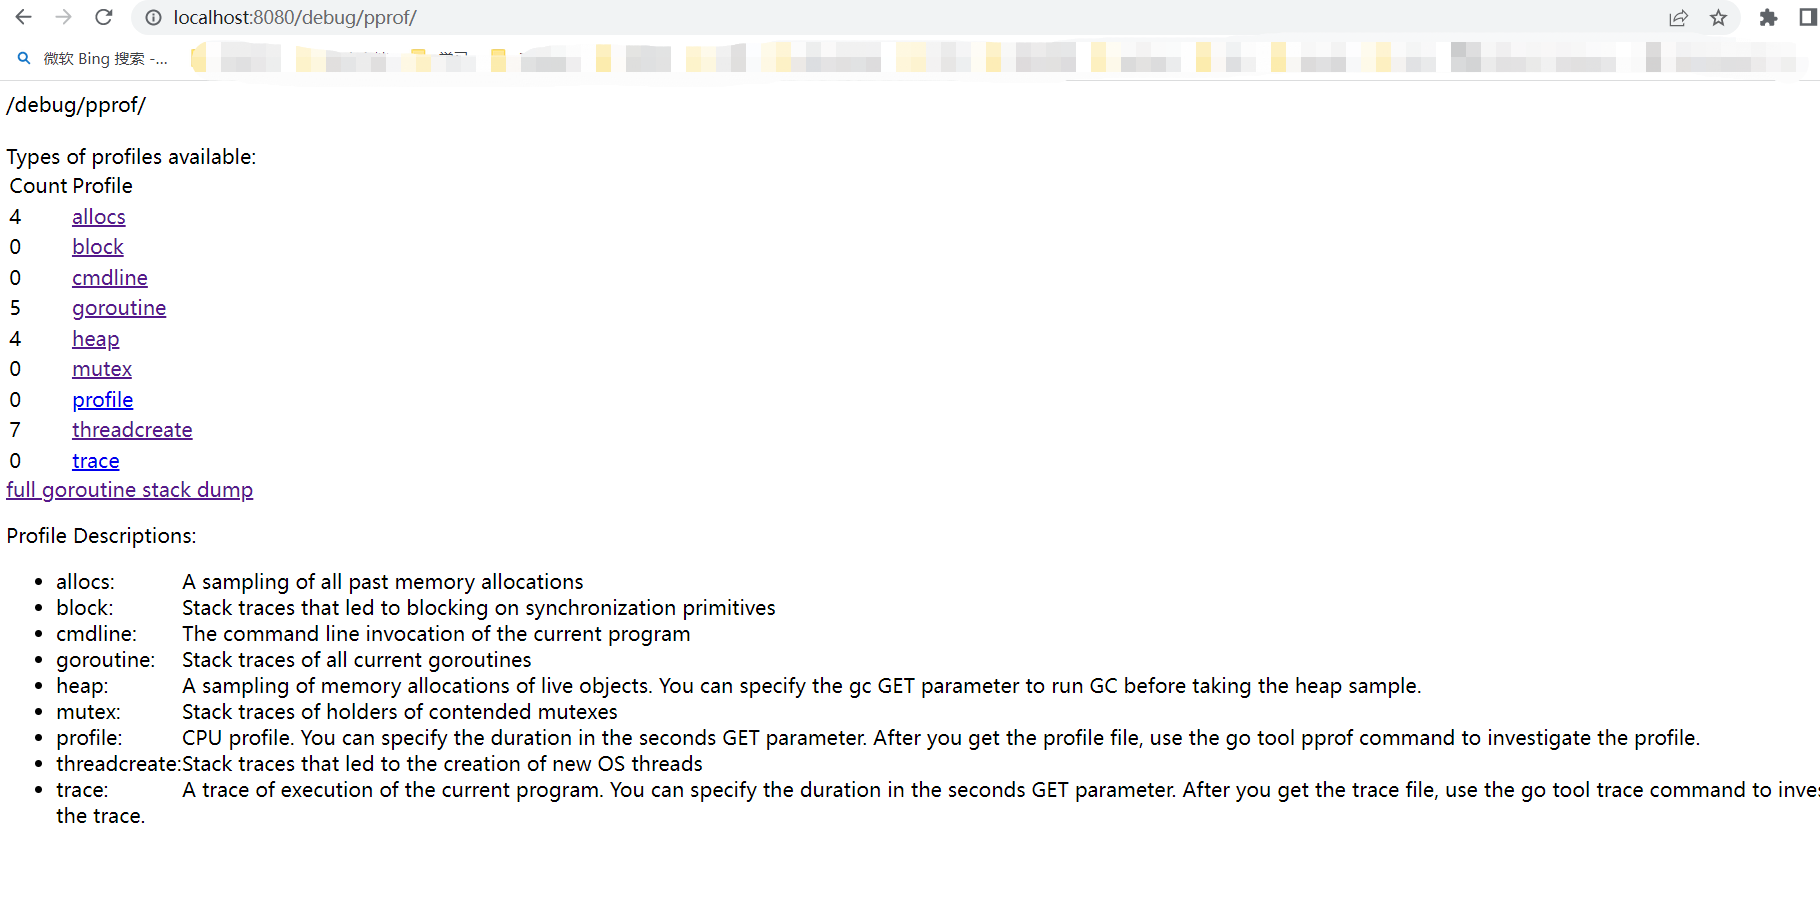
相关子页面:
cpu(CPU Profiling): $HOST/debug/pprof/profile,默认进行 30s 的 CPU Profiling,得到一个分析用的 profile 文件
block(Block Profiling):$HOST/debug/pprof/block,查看导致阻塞同步的堆栈跟踪
goroutine:$HOST/debug/pprof/goroutine,查看当前所有运行的 goroutines 堆栈跟踪
heap(Memory Profiling): $HOST/debug/pprof/heap,查看活动对象的内存分配情况
mutex(Mutex Profiling):$HOST/debug/pprof/mutex,查看导致互斥锁的竞争持有者的堆栈跟踪
threadcreate:$HOST/debug/pprof/threadcreate,查看创建新OS线程的堆栈跟踪
通常我们比较关心的就是 cpu/block/heap/mutex 相关信息了。
2.通过命令行
go tool pprof http://localhost:8080/debug/pprof/profile?seconds=20
查看性能耗时
$ go tool pprof http://localhost:8080/debug/pprof/profile?seconds=20
Fetching profile over HTTP from http://localhost:8080/debug/pprof/profile?seconds=20
Saved profile in C:\Users\wendong\pprof\pprof.samples.cpu.002.pb.gz
Type: cpu
Time: Mar 22, 2023 at 11:19am (CST)
Duration: 20.01s, Total samples = 40ms (  0.2%)
Entering interactive mode (type "help" for commands, "o" for options)
(pprof)  top 10
Showing nodes accounting for 40ms, 100% of 40ms total
Showing top 10 nodes out of 26
      flat  flat%   sum%        cum   cum%
      10ms 25.00% 25.00%       10ms 25.00%  os.(*File).checkValid (inline)
      10ms 25.00% 50.00%       10ms 25.00%  runtime.(*mheap).allocSpan
      10ms 25.00% 75.00%       10ms 25.00%  runtime.(*profBuf).read
      10ms 25.00%   100%       10ms 25.00%  runtime.startm
         0     0%   100%       10ms 25.00%  log.(*Logger).Output
         0     0%   100%       10ms 25.00%  log.Println
         0     0%   100%       10ms 25.00%  main.main.func1
         0     0%   100%       10ms 25.00%  os.(*File).Write
         0     0%   100%       10ms 25.00%  runtime.(*mcache).nextFree
         0     0%   100%       10ms 25.00%  runtime.(*mcache).refill
执行该命令后,需等待 60 秒(可调整 seconds 的值),pprof 会进行 CPU Profiling。结束后将默认进入 pprof 的交互式命令模式,可以对分析的结果进行查看或导出。具体可执行 pprof help 查看命令说明
相关显示:
flat:给定函数上运行耗时
flat%:同上的 CPU 运行耗时总比例
sum%:给定函数累积使用 CPU 总比例
cum:当前函数加上它之上的调用运行总耗时
cum%:同上的 CPU 运行耗时总比例
最后一列为函数名称,在大多数的情况下,我们可以通过这五列得出一个应用程序的运行情况,加以优化
2.go tool pprof http://localhost:8080/debug/pprof/heap
查看内存分配
$ go tool pprof http://localhost:8080/debug/pprof/heap
Fetching profile over HTTP from http://localhost:8080/debug/pprof/heap
Saved profile in C:\Users\wendong\pprof\pprof.alloc_objects.alloc_space.inuse_objects.inuse_space.003.pb.gz
Type: inuse_space
Time: Mar 22, 2023 at 11:23am (CST)
Entering interactive mode (type "help" for commands, "o" for options)
(pprof) top
Showing nodes accounting for 4135.63kB, 100% of 4135.63kB total
Showing top 10 nodes out of 35
      flat  flat%   sum%        cum   cum%
 1184.27kB 28.64% 28.64%  1184.27kB 28.64%  runtime/pprof.StartCPUProfile
  902.59kB 21.82% 50.46%   902.59kB 21.82%  compress/flate.NewWriter
  512.50kB 12.39% 62.85%   512.50kB 12.39%  runtime.allocm
  512.20kB 12.39% 75.24%   512.20kB 12.39%  runtime.malg
  512.05kB 12.38% 87.62%   512.05kB 12.38%  regexp/syntax.(*parser).newRegexp (inline)
  512.02kB 12.38%   100%   512.02kB 12.38%  go-pprof-abc/data.Add (inline)
         0     0%   100%   902.59kB 21.82%  compress/gzip.(*Writer).Write
         0     0%   100%   512.05kB 12.38%  internal/profile.init
         0     0%   100%   512.02kB 12.38%  main.main.func1
         0     0%   100%  1184.27kB 28.64%  net/http.(*ServeMux).ServeHTTP
(pprof)

# -inuse_space:分析应用程序的常驻内存占用情况

# -alloc_objects:分析应用程序的内存临时分配情况
查看更多如 阻塞、互斥锁状态见下面命令:
go tool pprof http://localhost:8080/debug/pprof/block

go tool pprof http://localhost:8080/debug/pprof/mutex
4.通过pprof可视化界面
准备工作
在进行此操作前,请确认你已经安装 graphviz, 相关安装请移至参考文档。
另外建议先下载google的 pprof工具,其提供的火焰图比go 1.19自带的火焰图多更多的信息。
go install github.com/google/pprof@latest
编写测试用例
d_test.go
package data

import "testing"

const url = "http://github.com/hahaha"

func TestAdd(t *testing.T) {
	s := Add(url)

	if s == "" {
		t.Errorf("Test.Add error!")
	}
}

func BenchmarkAdd(b *testing.B) {
	for i := 0; i < b.N; i++ {
		Add(url)
	}
}
执行测试用例
$ cd data

$ go test -bench=. -cpuprofile=cpu.prof -memprofile=mem.prof
goos: windows
goarch: amd64
pkg: go-pprof-abc/data
cpu: AMD Ryzen 7 4700U with Radeon Graphics
BenchmarkAdd-8          16872606                75.34 ns/op
PASS
ok      go-pprof-abc/data       1.785s

# 测试生成cpu/mem的文件信息
启动pprof可视化界面
方法一:
$ go tool pprof -http=:8080 cpu.prof
方法二:
$ go tool pprof cpu.prof
$ (pprof) web
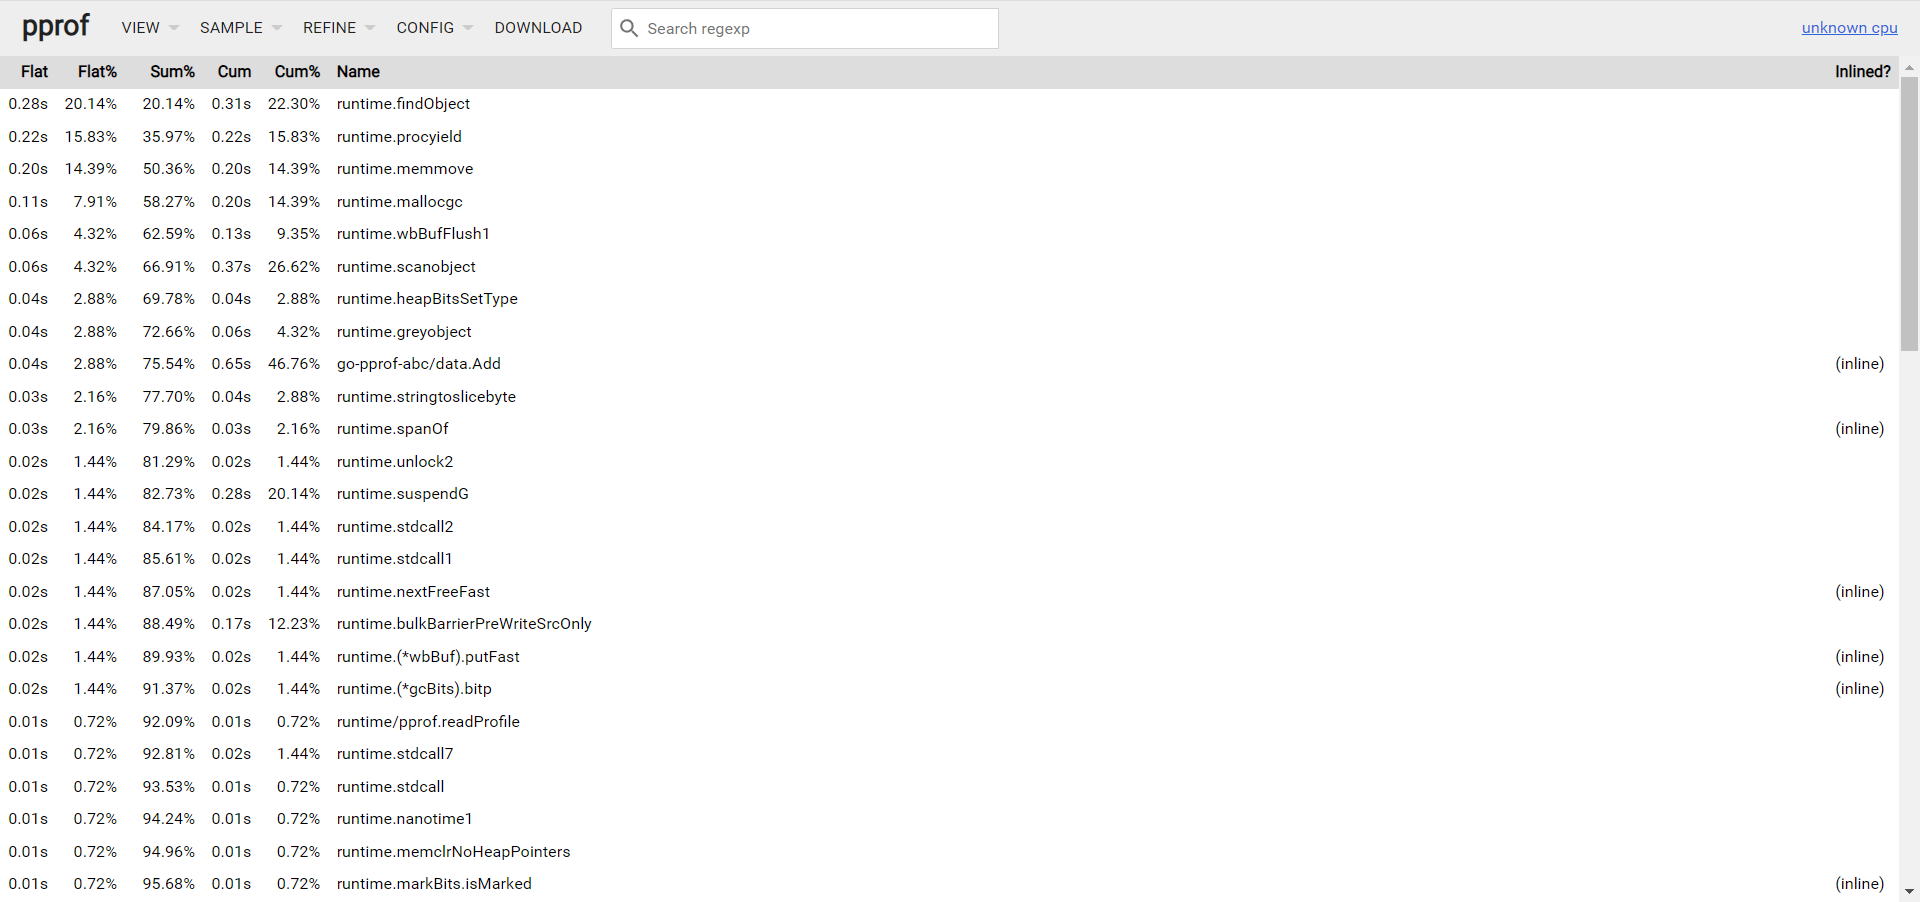
查看可视化界面
- TOP
-
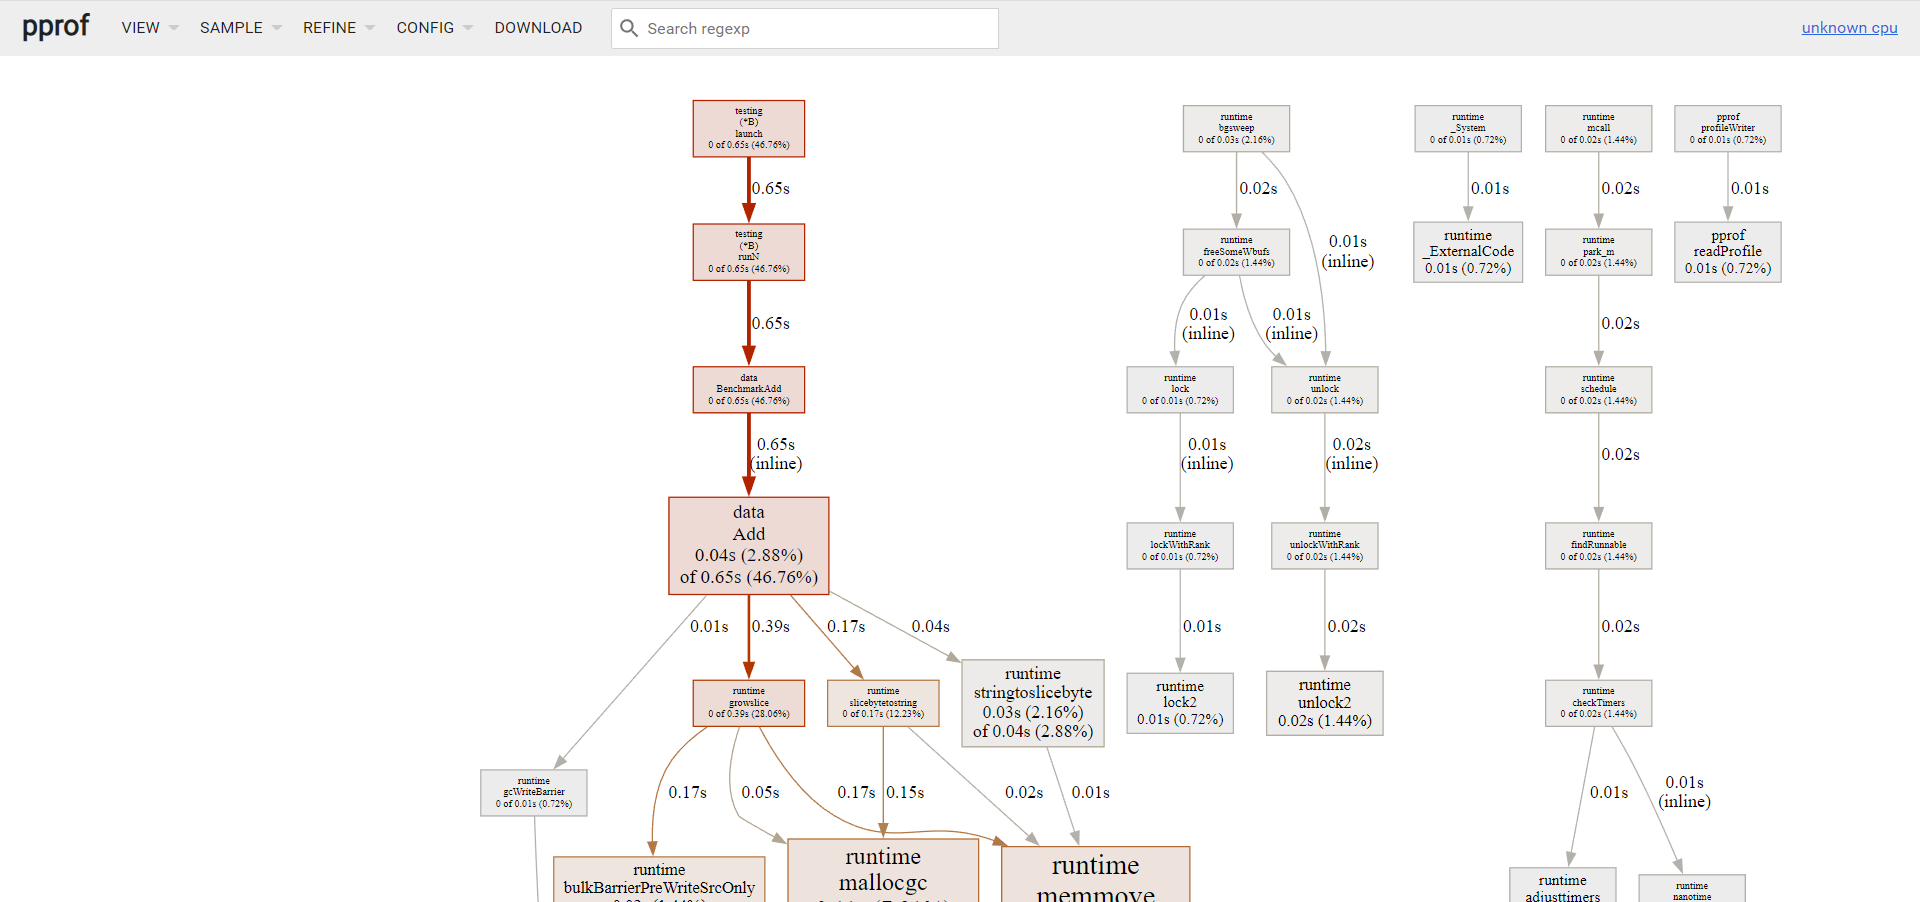
Graph
![]()
-
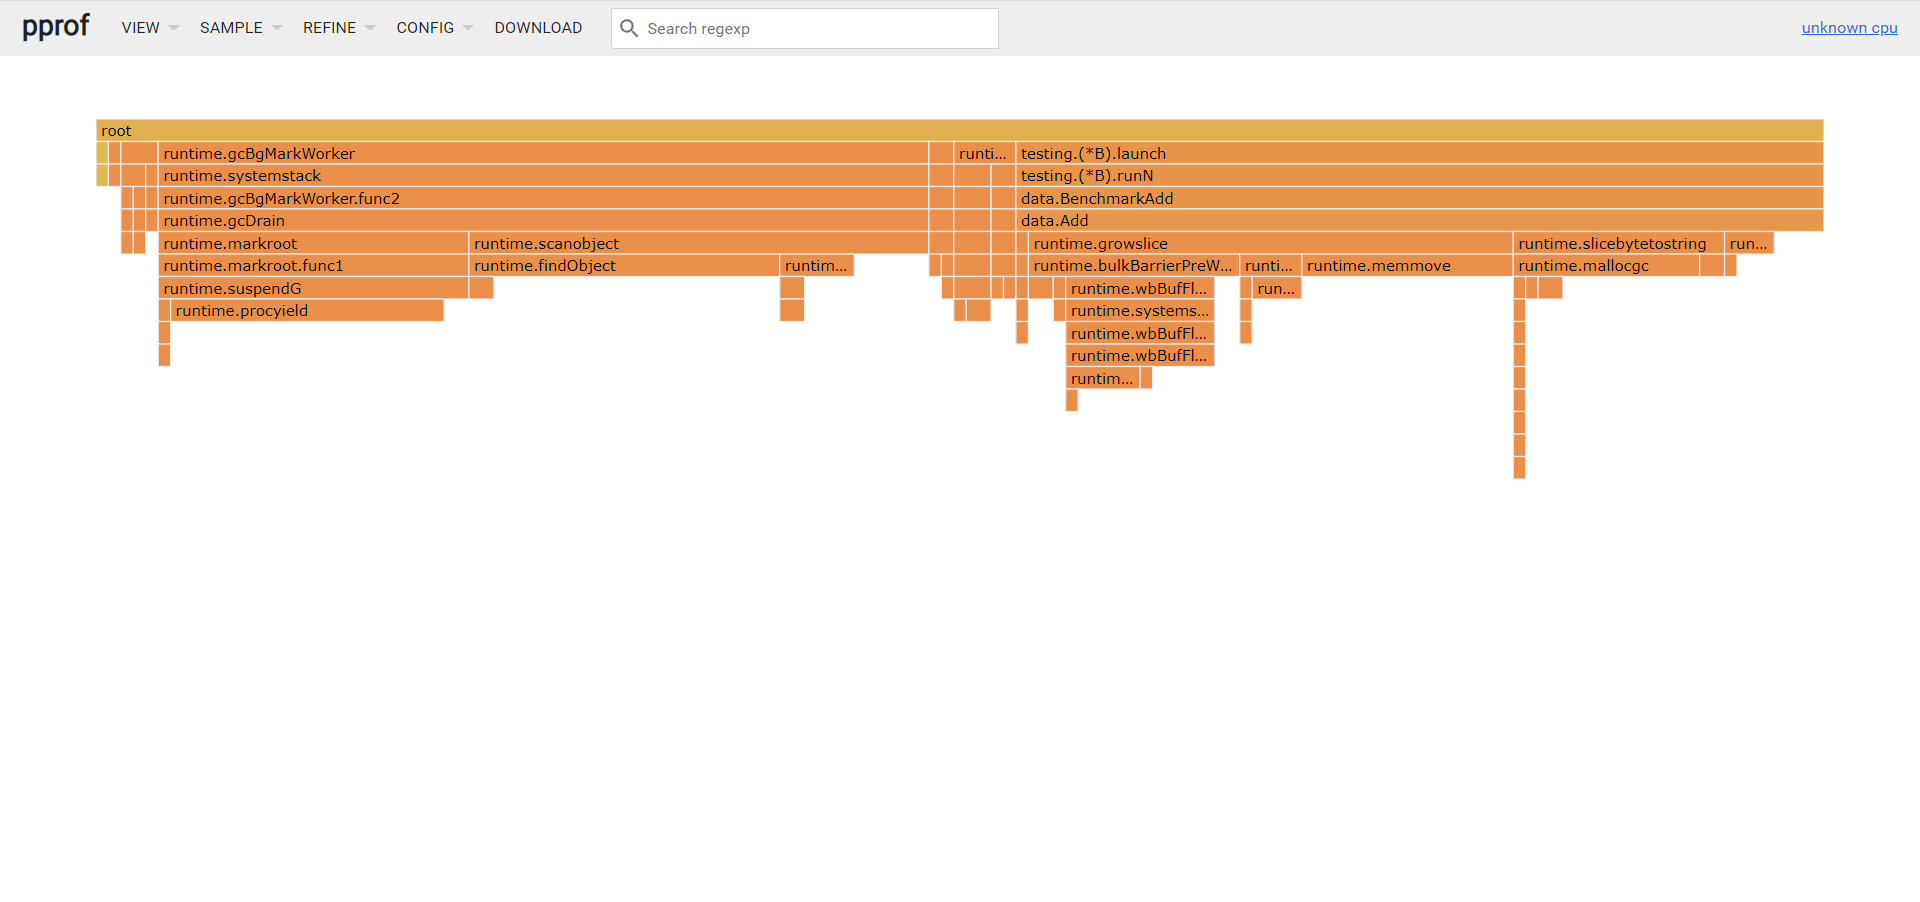
Flame Graph
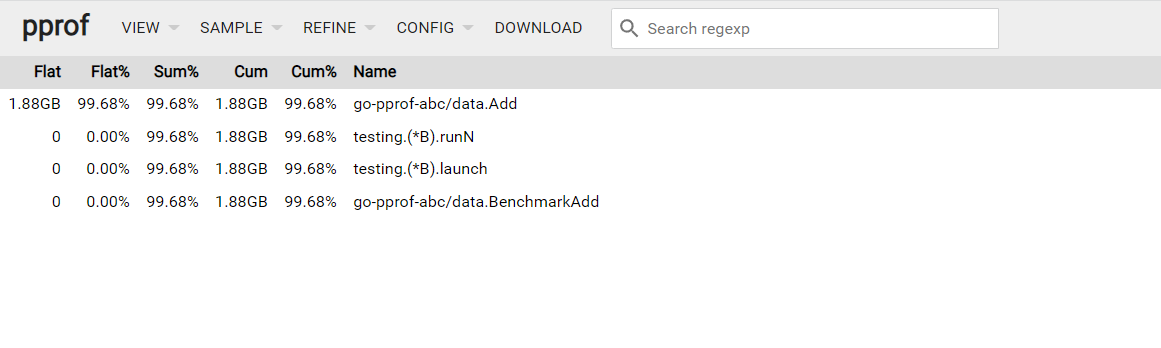
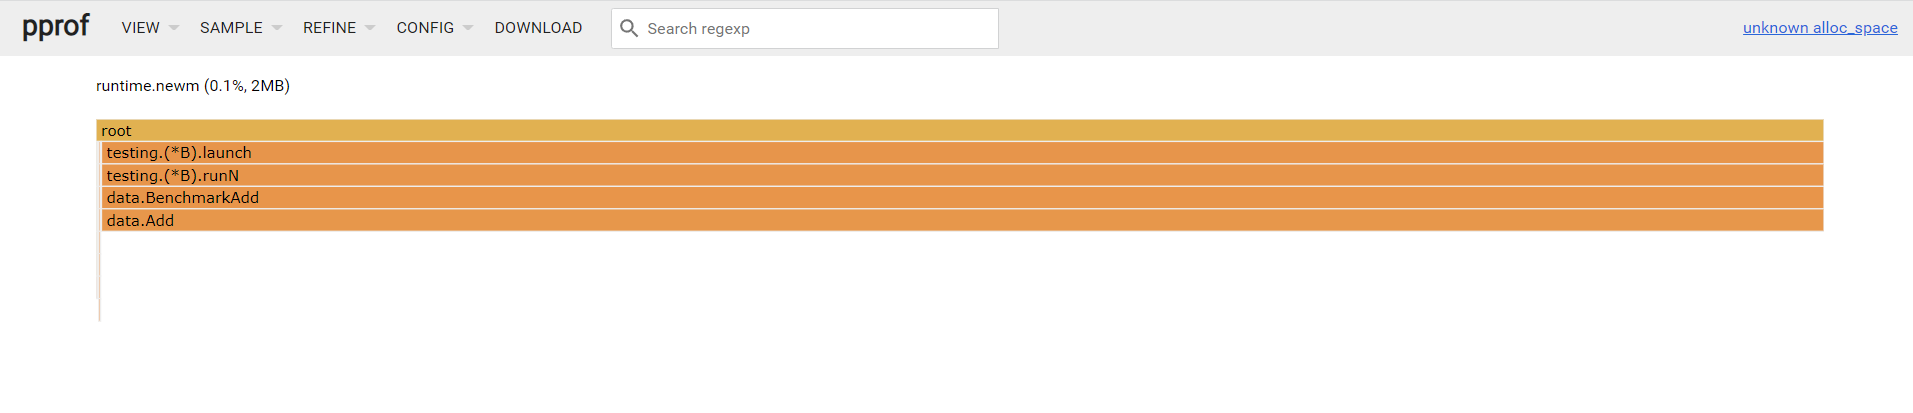
看看 mem.prof
-
Top
![]()
-
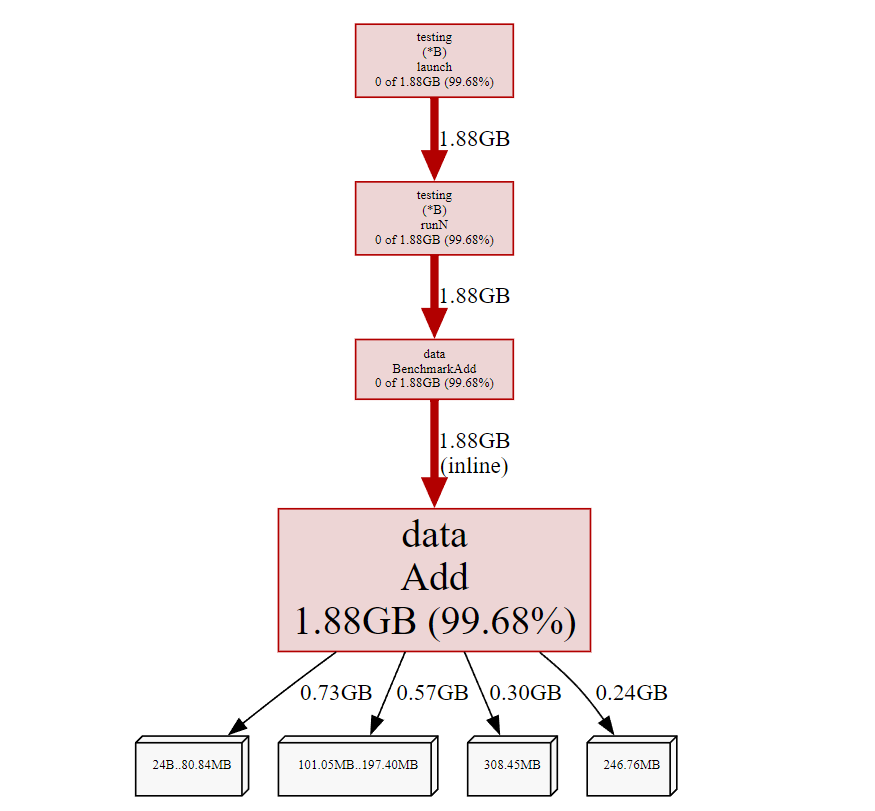
Graph
![]()
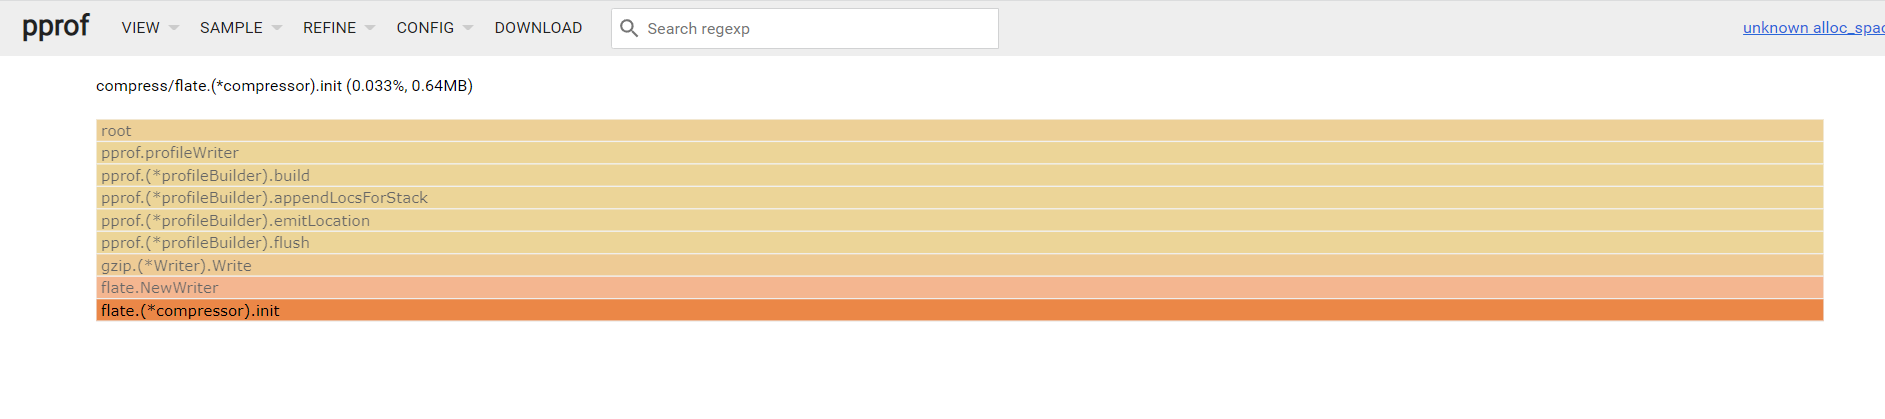
-
Flame Graph
通过pprof工具查看
$ pprof -http=:8080 cpu.prof
Serving web UI on http://localhost:8080

pprof new flame graph
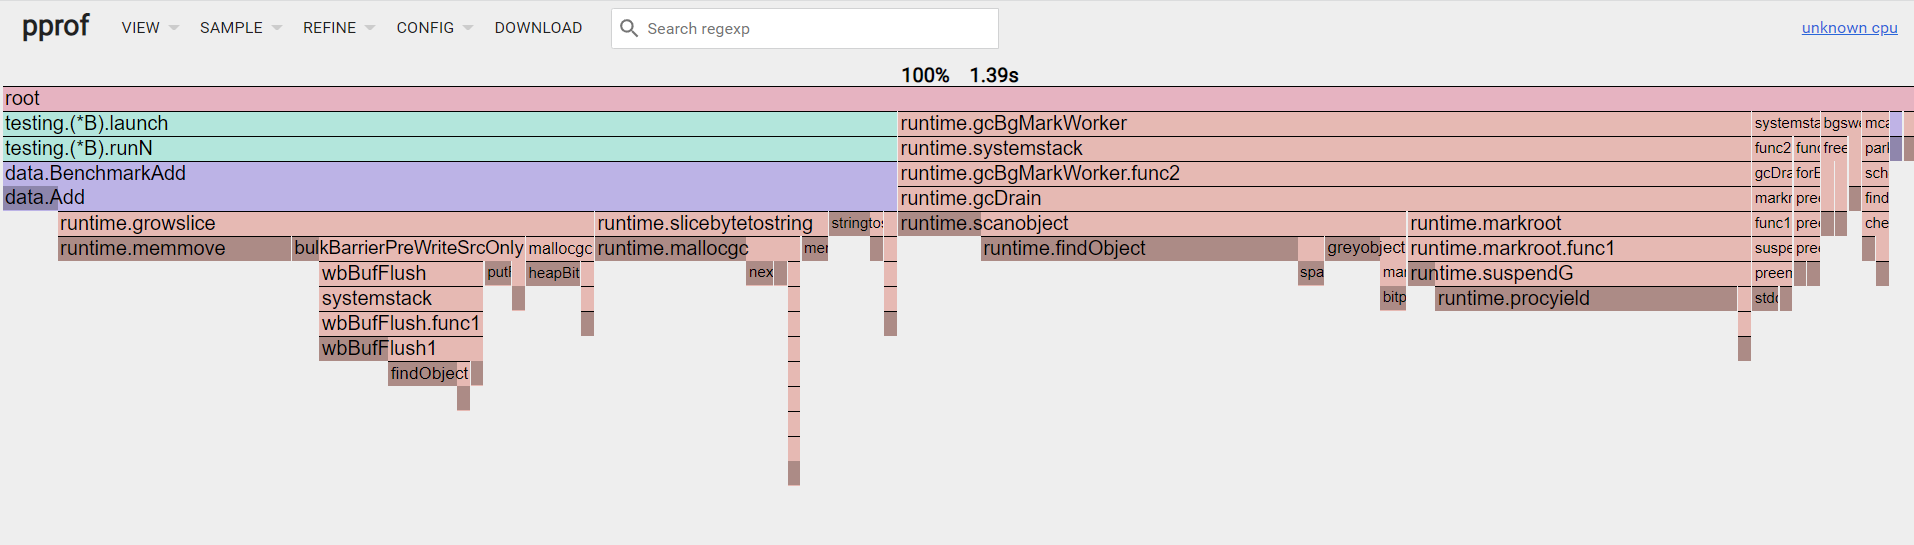
关于火焰图
火焰图最大优点是动态的。调用顺序由上到下(A -> B -> C -> D),每一块代表一个函数,越大代表占用 CPU 的时间更长。同时它也支持点击块深入进行分析!


 浙公网安备 33010602011771号