octave
https://www.coursera.org/learn/machine-learning/resources/QQx8l
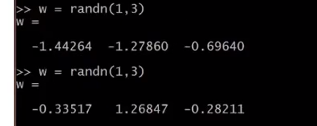 服从高斯分布 放差标准差为1

10000元素的向量
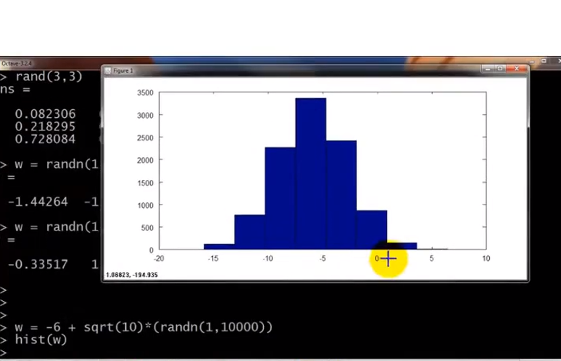
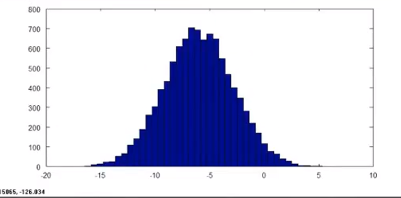
hist 绘图 hist(w,50) 50个竖条

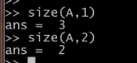
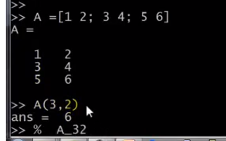
返回行数 列数
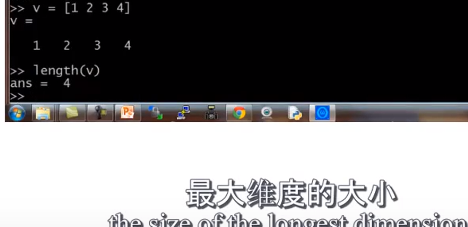
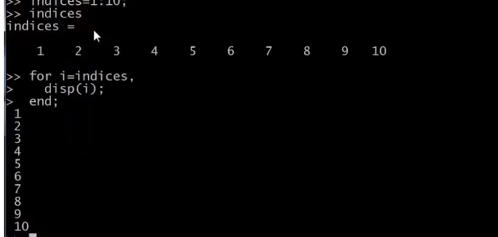
length


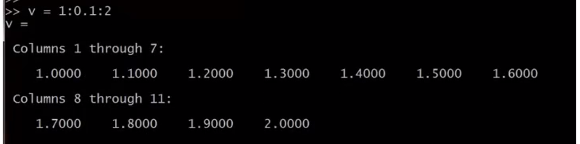
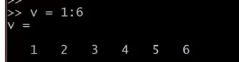
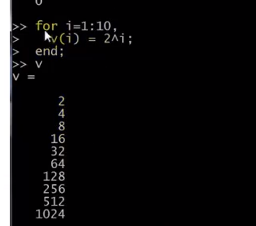
 v
v

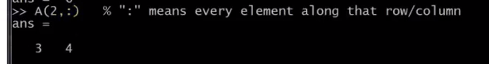
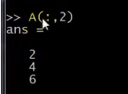
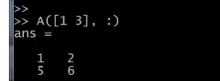 1 3 行所有列的元素
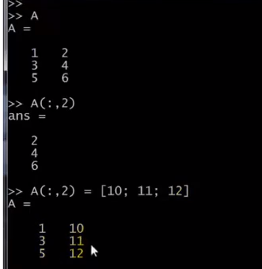

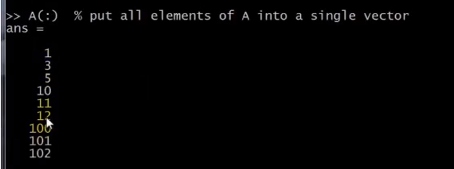
 和[A,B]一样

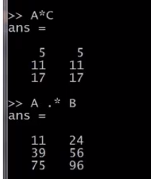 乘法和点乘
乘法和点乘
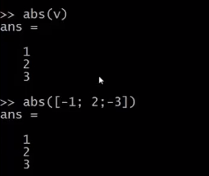
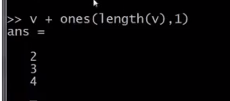 v 是(1,2,3)' 也可以v+1

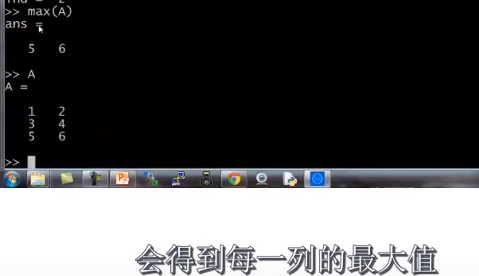 如果是矩阵会得到每一列的最大值

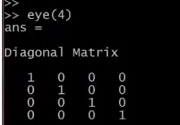
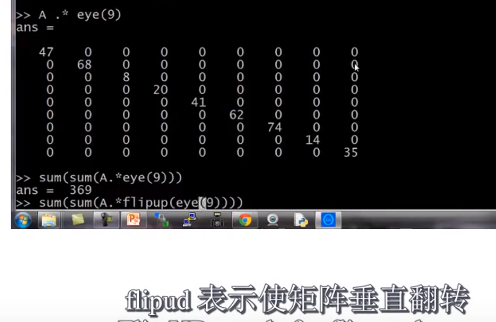
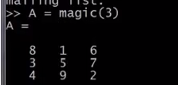 任意行列对角线加起来等于相同的值 ML基本用不到
sum 统加 proud 统乘
 向下向上取整
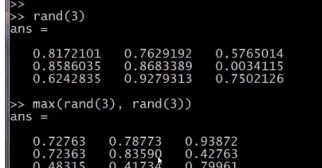
第二种是两个3*3矩阵的较大值组成
 2就是每一行的最大值

整个矩阵的最大值

每列求和
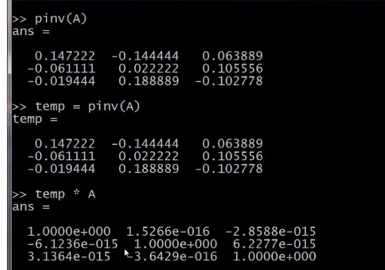 求逆
求逆
%% plotting
t = [0:0.01:0.98];
y1 = sin(2*pi*4*t);
plot(t,y1);
y2 = cos(2*pi*4*t);
hold on; % "hold off" to turn off
plot(t,y2,'r');
xlabel('time');
ylabel('value');
legend('sin','cos');
title('my plot');
print -dpng 'myPlot.png'
close; % or, "close all" to close all figs
figure(1); plot(t, y1); //图1
figure(2); plot(t, y2); %图2
figure(2), clf; % can specify the figure number
subplot(1,2,1); % Divide plot into 1x2 grid, 最后一个1的意思:access 1st element
plot(t,y1); 然后上图
subplot(1,2,2); % Divide plot into 1x2 grid, access 2nd element 2的意思
plot(t,y2); 上图
axis([0.5 1 -1 1]); % change axis scale x轴和 y轴的范围
clf清除图像
%% display a matrix (or image)
figure;
imagesc(magic(15)), colorbar, colormap gray; 不同颜色对应不同数值 颜色条 和灰色分布
% comma-chaining function calls.
a=1,b=2,c=3 一个接一个执行
a=1;b=2;c=3;
function y = squareThisNumber(x)
y = x^2; 返回一个值存放于y 要一个自变量x

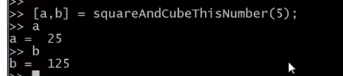 多个返回值
多个返回值

 浙公网安备 33010602011771号