phpstorm+xdebug详解
Xdebug + Postman 调试环境配置
https://blog.csdn.net/wuxing164/article/details/108592574
开启 postman 的 phpstorm 调试功能大致如下:
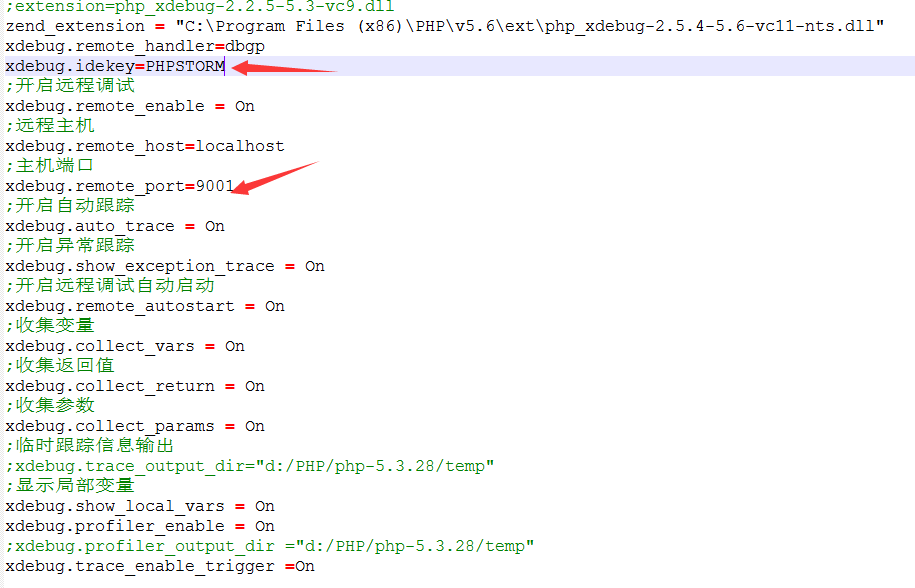
- 一般会在配置文件 php.ini 的 xdebug 配置中指定 idekey 。
[xdebug]

xdebug.remote_enable = on # 启用远程调试

xdebug.remote_host = 127.0.0.1

xdebug.remote_port = 9010 # 监听端口

xdebug.remote_handler = dbgp

xdebug.idekey = PHPSTORM

xdebug.remote_log = /tmp/xdebug.log

......
-
打开 postman ,右边找到 Cookies 。
![找 cookies]()
-
点击 Cookies ,填入 XDEBUG_SESSION=PHPSTORM ,之后即可调起 phpstorm 的调试功能
![填入 XDEBUG_SESSION=PHPSTORM]()
-
在 Headers 中新增 {KEY:Cookie,VALUE:XDEBUG_SESSION=PHPSTORM}
![headers add]()
-
然后发起 send 请求,由 PHPstorm 捕捉,成功进入断点。


注意: 若是还无法成功捕捉断点,可以在 Headers 里新增 XDEBUG_SESSION_START 的值尝试一下。
其中,XDEBUG_SESSION_START 的值在 PHPstorm 开启调试的右上角 Debugger 中可以找到。
点击 Run 或者 甲壳虫Debug ,执行将会打开游览器,在 URL地址栏 中找到 ?XDEBUG_SESSION_START=PHPPHPSTORM ,将值填入即可
---------------------------------------------------------------------------------------------------------------------------------------------------------------------------------------------------------------
1.run->edit configurations
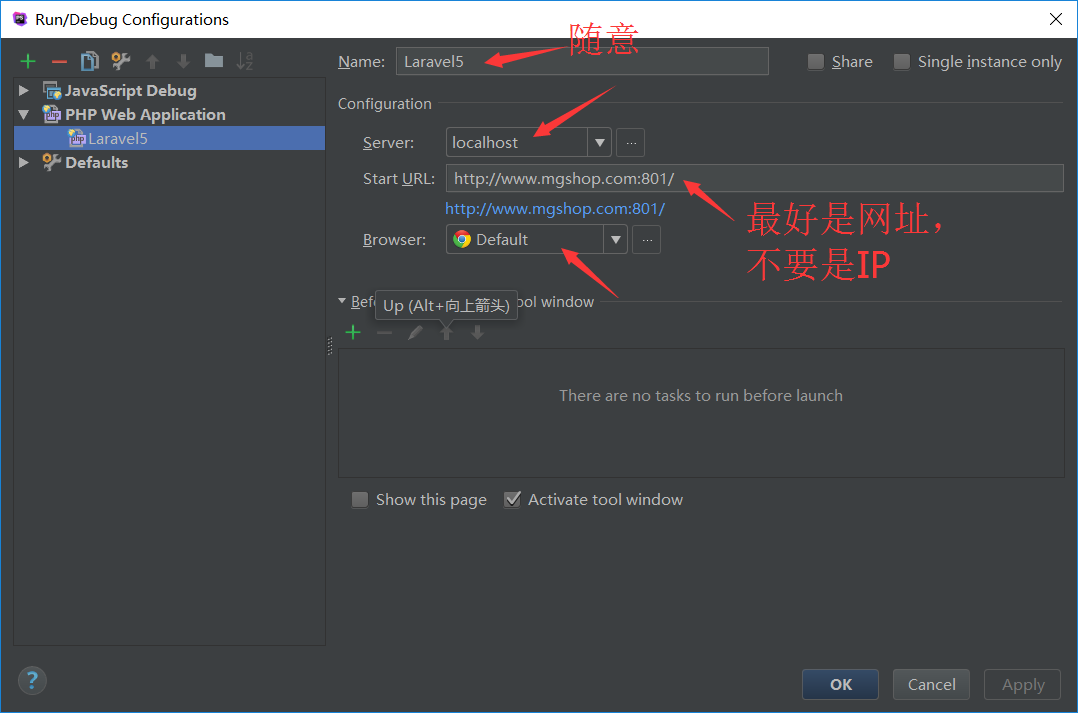
StartUrl最好是网址,不然容易出错,Server选择的是配置时添加的Servers,详可参考:http://www.cnblogs.com/cxscode/p/7045944.html
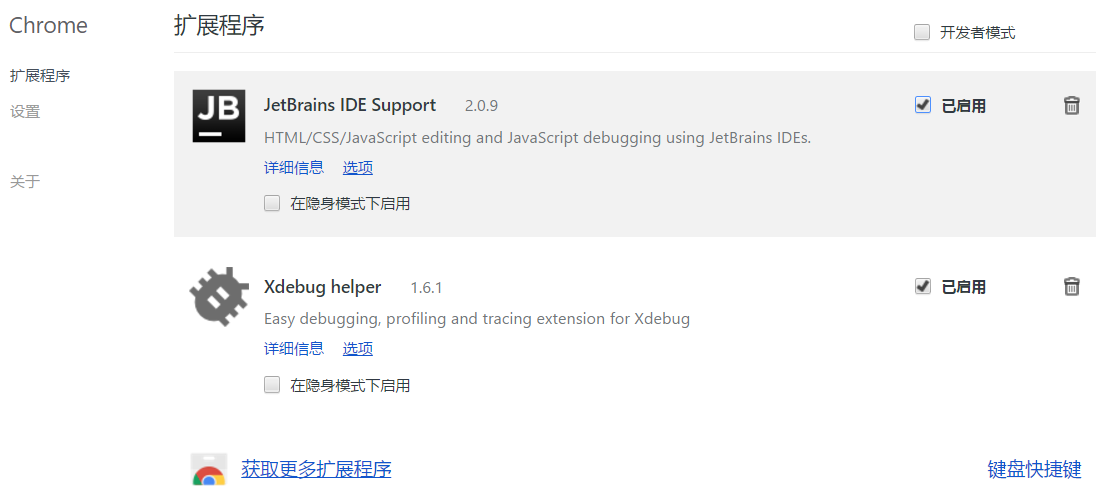
2. Chrome谷歌浏览器的扩展我安装了两个,并且都开启了
JetBrains IDE Support 百度网盘:http://pan.baidu.com/s/1cw9Heu 密码:rw01
xdebug helper for chrome百度网盘:链接:http://pan.baidu.com/s/1i5DW11b 密码:u29d
3.访问页面准备进入断点时,PHPStorm报错:Cannot accept external Xdebug connection: Cannot evaluate expression'isset($_SERVER['PHP_IDE_CONFIG'])';
导致此问题的一个可能原因是:服务器端的php.ini中配置了:
extension=/path/xdebug.so
应该只保留下面一个:
zend_extension=/path/xdebug.so
4.另外端口9000最好改成9001,phpstorm和xdebug要同步,IDEkey同理,要保持一致


 浙公网安备 33010602011771号