Flink日志接入ELK
准实时的邮件直接告警很容易将公司的邮箱服务打爆,如果将日志接入ELK,一方面能实现日志的统一存储,方便后续查看追踪,另一方面也能根据特定级别的日志量进行分析,实现曲线预警。
logback将日志接入ELK,可以将日志先打到Kafka,es再费kafka的消息。
lobback原生是没有写入kafka的组件,需要使用到第三方的包 :danielwegener/logback-kafka-appender 在git上可以搜索到
因为logback-kafka-appender还依赖了其他包,方便起见,直接将源码拉下来本地把所有依赖都打到一个依赖包中。

最终编译后的包就是logback-kafka-appender-0.2.0-RC2-jar-with-dependencies.jar
将这个包添加到 flink/lib下

然后在logback配置文件增加对应的appender
<appender name="kafkaAppender" class="com.github.danielwegener.logback.kafka.KafkaAppender">
<encoder class="ch.qos.logback.classic.encoder.PatternLayoutEncoder">
<pattern>%d{yyyy-MM-dd HH:mm:ss.SSS} flink [%thread] %-5level %logger{60} - %msg</pattern>
</encoder>
<topic>flink_log</topic>
<!-- we don't care how the log messages will be partitioned -->
<keyingStrategy class="com.github.danielwegener.logback.kafka.keying.NoKeyKeyingStrategy" />
<!-- use async delivery. the application threads are not blocked by logging -->
<deliveryStrategy class="com.github.danielwegener.logback.kafka.delivery.AsynchronousDeliveryStrategy" />
<!-- each <producerConfig> translates to regular kafka-client config (format: key=value) -->
<!-- producer configs are documented here: https://kafka.apache.org/documentation.html#newproducerconfigs -->
<!-- bootstrap.servers is the only mandatory producerConfig -->
<producerConfig>bootstrap.servers=xx.xx.xx.xx:9092,xx.xx.xx.xx:9092</producerConfig>
<!-- don't wait for a broker to ack the reception of a batch. -->
<producerConfig>acks=0</producerConfig>
<!-- wait up to 1000ms and collect log messages before sending them as a batch -->
<producerConfig>linger.ms=1000</producerConfig>
<!-- even if the producer buffer runs full, do not block the application but start to drop messages -->
<producerConfig>max.block.ms=0</producerConfig>
<!-- define a client-id that you use to identify yourself against the kafka broker -->
<producerConfig>client.id=flinkonyarn-${HOSTNAME}-${CONTEXT_NAME}-logback-relaxed</producerConfig>
</appender>
<root level="INFO">
<appender-ref ref="kafkaAppender"/>
</root>
因为我们的flink 启用了metrics,一直报转换number的warn
这个错误没有意义,只能另外增加一个logger过滤掉了
<logger name="org.apache.flink.runtime.metrics.MetricRegistryImpl" additivity="false">
<level value="ERROR"/>
<appender-ref ref="file"/>
</logger>
到这里,我们flink产生的日志都会打到kafka

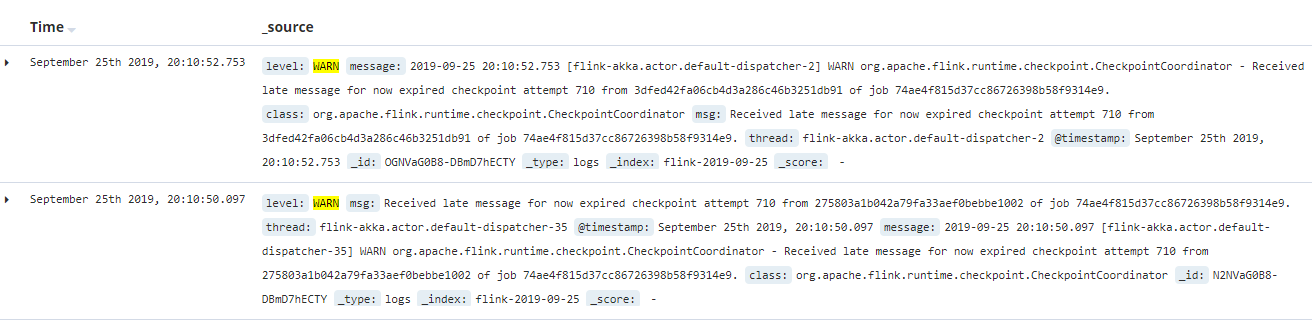
消费kafka的数据,写入es并通过kibana展示相关内容,可以很方便的查看日志内容
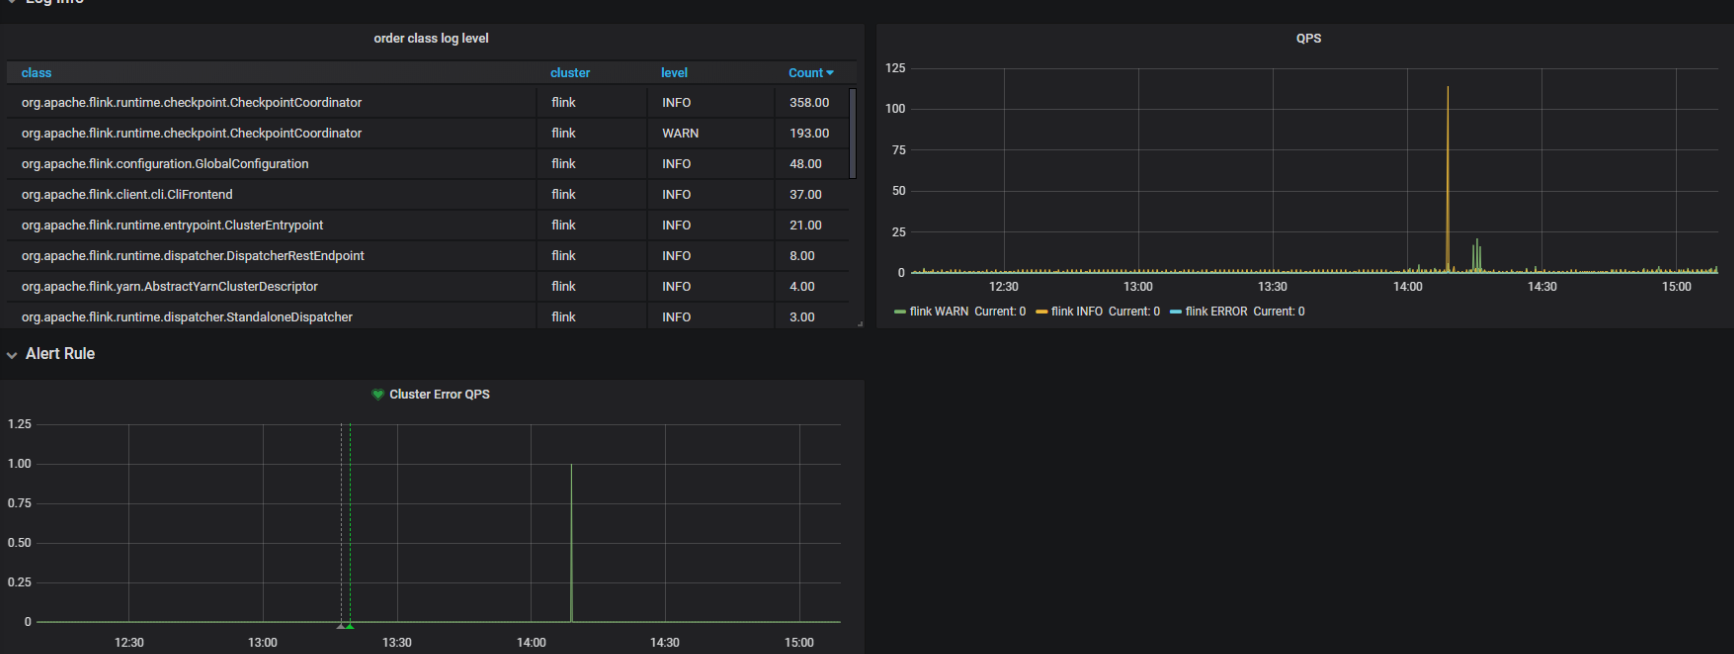
因为kibana暂时没有接入预警功能,所以在这里我们使用grafana聚合es数据,做最后的展示和预警
到这里就大功告成了.
参考资料
https://github.com/danielwegener/logback-kafka-appender
https://www.jianshu.com/p/d1be3364f32d
https://www.aiprose.com/blog/26


 浙公网安备 33010602011771号