【sas notes】proc sgplot
1 proc sgplot data=mysas.mmsone;
2     vbar date /response=wangnei stat=mean group=city;
3 run;
标准格式
proc sgplot data=***;
vbar(或hbar) variablename /options;
options include:response stat group barwidth transparency.
用于分类变量或非连续变量,也是一般在excel中常用的柱状图。

2、对连续型变量用histogram和density来查看分布方式。
histogram的参数有:scal and showbins
density的参数有: type(normal or kernel)
1 proc sgplot data=mysas.mmsone;
2     histogram wangnei/scale=proportion showbins;
3     density wangnei /type=normal;
4     density wangnei /type=kernel;
5 run;

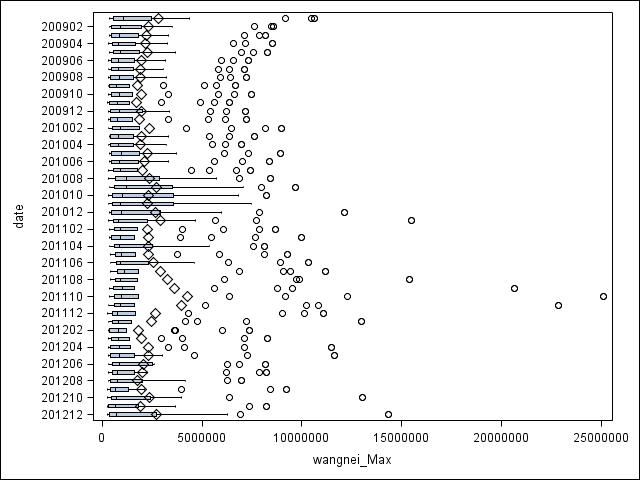
3、用vbox来绘制箱线图
1 proc sgplot data=mysas.reportmms;
2     hbox wangnei_max/category=date;
3 run;


 浙公网安备 33010602011771号