
golang--性能测试和分析
前言
测试分为:压力测试、负载测试、性能测试,功能测试等等,其中在开发过程中开发人员经常要写一些test case unit 自己的模块进行功能测试测和性能。在分析出模块的性能瓶颈后开发人员就需要针对性的调优,但需要提醒的是调优工程一般要放在最后在进行,过早地优化会浪费开发时间,而且有时在需求或者功能变动后就会变成无用功,这是显而易见的。
随着移动互联网的兴起,各种远端服务的性能遇到巨大的挑战,虽然硬件资源日益丰富,但成本的增加和用户体验的严苛,性能调优在软件开发中占的权重也越来越高,尤其是一些经常被调用的模块,如核心算法的部分,即使把每次执行的cpu运行的时间降低1%,把内存消耗降低1%,在面对海量的用户请求时对性能也会带来提升。
Go语言作为一个“新兴语言”,它自身为我们提供了一套用于性能测试和分析的工具和接口,作者这里结合一个具体实例来讲解一下简单的调优过程。
常用的测试命令
-
启动指定的测试函数
go test -run=xxx $packetpath -
编译一个测试binary文件
go test -c -o $binaryname -
启动一个bench测试
go test -bench=xxx -run=None在 -bench 的选项上设置一个None代表着不运行功能测试函数即Test开头的函数,-bench后面接的是一个匹配项,任何符合该匹配项的Bench测试函数都会被触发执行。
go test -bench=xxx -run=None -benchmem添加 -benchmem 会显示出测试过程中分配mem的数量。
-
启动profile分析
在go 自带的工具中支持三种profile收集: cpu、block、memory,cpuprofile 是用来记录各个事件或函数对cpu的消耗情况的数据;blockprofile是为了记录携程阻塞的操作,可以用来分析每个阻塞操作占用的时间;memprofile是用于堆性能剖析,记录携程内部堆分配的具体情况。
    go test -bench=xxx -run=None -cpuprofile=cpu.out
    go test -bench=xxx -run=None -blockprofile=block.out
    go test -bench=xxx -run=None -memprofile=mem.out
无论是cpu分析、阻塞分析、堆分析,主要目的都是为了消耗更少的计算资源、内存资源来取得更高的效率,但有时候时间和空间并不能兼得,用空间换时间是很常用的一种做法,需要根据具体情况进行权衡。
-
枚举包内的文件
    # 枚举一个包中的.go 文件
    go list -f={{.GoFiles}}

    # 枚举一个包中的_test.go文件
    go list -f={{.TestGoFiles}}

    # 枚举一个包中的外部测试文件
    go list -f={{.XTestGoFiles}}
外部测试文件:在一些特殊情况下,外部测试包需要对待测试包有特殊的访问权限,例如为了避免循环引用,一个白盒测试必须存在一个单独的包中,在这种情况下我们使用了一种小技巧:在包内测试未见中添加一些函数声明,将包内部的功能暴露给外部测试,这种做法为为包测试留了一个“后门”。如果一个源文件的存在的唯一目的就在于此,并且自己不包含任何测试,它们一般称作export_test.go
-
测试覆盖率
在测试的时候有一种最简单的统计方法--语句覆盖率,部分语句在一次测试过程中至少执行了一次,则称之为覆盖,否则为非覆盖。# 执行测试并生成coverprofile 文件 go test -run=TransferProofGenerator -cover -coverprofile=c.out # 查看覆盖率,通过go tool 工具 go tool cover -html=c.out // 会在浏览器中打开一个测试报告如果在生成profile的命令中加入了 -covermode=count 的标记,则可以标记出执行效率较高和较低的模块。
性能剖析流程
这里作者会结合一个示例来说明一下性能剖析的具体操作流程。性能调优首要的任务就是找出消耗时间最多的函数。
-
收集程序的profile
一般收集有两种方法,一种是通过工具命令来收集,上面已经提到了;另一种是通过调用相关模块来收集,这里面以cpuprofile为例:
import(
    "runtime/pprof"
    "testing"
    "os"
)
func BenchmarkXXX(b *testing.B){
    fd, _ := os.OpenFile("cpu.log", os.O_CREATE| os.O_RDWR, os.ModeSetuid)

    if err := pprof.StartCPUProfile(fd); err != nil{
        b.Fatalf("TestTransferProofValidator %s", err.Error())
    }

    defer func() {
        pprof.StopCPUProfile()
        fd.Close()
    }()
}
这样在执行后自动就会生成cpuprofile文件,这里是将函数放在里Bench测试函数中,也可以将它放在正常函数中比如main函数。有的时候需要实时的监听web服务的运行状态,这个时候就可以通过引入net/http/pprof来收集profile:
package main

import (
    "net/http"
    "github.com/utxo/webserver/router"
    _ "net/http/pprof"
)

func main()  {
    handler:= http.FileServer(http.Dir("./template"));
    http.Handle("/", handler)
    http.HandleFunc("/transfer", router.Transfer);
    http.ListenAndServe("0.0.0.0:8082", nil);
}
此时会默认开启proof收集服务,go tool作为客户端来访问该router来收集profile:
go tool pprof http://localhost:8082/debug/pprof/profile在收集结束后会进入cmd命令界面(默认进行 30s 的 CPU Profiling收集),通过命令行来查看、处理收集到的数据。
-
查看profile数据
go tool pprof -text -nodecount=10 cpu.log-nodecount 函数会为我们列出cpu时间消耗前十的函数。也可以进入cmd模式,进行更详细的剖析:
go tool pprof list cpu.log
详细示例
-
作者这里展示的是一个零知识证明的生成和校验的算法的性能分析过程,按照上节所说我们先收集profile,使用的方法是调用pprof模块的方法:
func BenchmarkTransferProofValidator(b *testing.B) {
    once.Do(testInit)
    fd, _ := os.OpenFile("cpu_validator.log", os.O_CREATE| os.O_RDWR, os.ModeSetuid)


    inputs, T := generateInputs(100, big.NewInt(1000000))
    proof, output, B, err := TransferProofGenerator(inputs, T, pairsA, pairsB,
        zkpKeyPairsA, zkpKeyPairsB, zkpRange)
    if err != nil{
        b.Fatalf("TestTransferProofValidator: %s", err.Error())
    }

    if err := pprof.StartCPUProfile(fd); err != nil{
        b.Fatalf("TestTransferProofValidator %s", err.Error())
    }
    defer func() {
        pprof.StopCPUProfile()
        fd.Close()
    }()

    for i := 0; i < b.N; i++ {
        err = TransferProofValidator(inputs, output, B, pairsA, pairsB,
            zkpKeyPairsA, zkpKeyPairsB, proof)
        if err != nil{
            b.Fatalf("TestTransferProofValidator: %s", err.Error())
        }
    }
}
执行如下命令:
go test -c -bench=BenchmarkTransferProofValidator -run=None显示结果如下:
 D:\gopath\src\github.com\utxo\balance>go test -run=None -bench=Va
 goos: windows
 goarch: amd64
 pkg: github.com/utxo/balance
 BenchmarkTransferProofValidator-4              3         397296900 ns/op
 PASS
 ok      github.com/utxo/balance 3.237s
TransferProofValidator运行了三次,gomaxprocs = 4,这些都是go tool自动分配,暂时不用深究。 可以看到我们的函数运行十分的缓慢,执行一次需要 0.4s 左右,它将作为一个高频调用的模块远远达不到使用的需求。
-
接下来我们要找到耗时最多的那个部分:
go tool pprof list cpu_validator.log显示结果如下:
 D:\gopath\src\github.com\utxo\balance> go tool pprof list  cpu_validator.log
 list: open list: The system cannot find the file specified.
 Fetched 1 source profiles out of 2
 Main binary filename not available.
 Type: cpu
 Time: Dec 20, 2018 at 11:15pm (CST)
 Duration: 625.81ms, Total samples = 420ms (67.11%)
 Entering interactive mode (type "help" for commands, "o" for options)
 (pprof) top
 Showing nodes accounting for 420ms, 100% of 420ms total
 Showing top 10 nodes out of 25
     flat  flat%   sum%        cum   cum%
     240ms 57.14% 57.14%      240ms 57.14%  math/big.addMulVVW
     110ms 26.19% 83.33%      380ms 90.48%  math/big.nat.montgomery
     30ms  7.14% 90.48%       30ms  7.14%  runtime.memmove
     10ms  2.38% 92.86%       10ms  2.38%  math/big.(*Int).QuoRem
     10ms  2.38% 95.24%       10ms  2.38%  math/big.nat.add
     10ms  2.38% 97.62%       10ms  2.38%  runtime.lock
     10ms  2.38%   100%       20ms  4.76%  runtime.newstack
         0     0%   100%      400ms 95.24%  github.com/utxo/balance.BenchmarkTransferProofValidator
         0     0%   100%      400ms 95.24%  github.com/utxo/balance.TransferProofValidator
         0     0%   100%      400ms 95.24%  github.com/utxo/crypto/base.Exp
每一行表示一个函数的信息。前两列表示函数在 CPU 上运行的时间以及百分比;第三列是当前所有函数累加使用 CPU 的比例;第四列和第五列代表这个函数以及子函数运行所占用的时间和比例(也被称为累加值 cumulative),应该大于等于前两列的值;最后一列就是函数的名字。如果应用程序有性能问题,上面这些信息应该能告诉我们时间都花费在哪些函数的执行上了。
以上面显示的结果为例,根据cum来观察大部分的时间都花费在了Exp的执行过程中(base.Exp 函数在其他模块内被调用),我们可以通过list命令来仔细分析一下Exp函数中在那部分比较耗时:
 Total: 420ms
 ROUTINE ======================== github.com/utxo/crypto/base.Exp in D:\gopath\src\github.com\utxo\crypto\base\base.go
         0      400ms (flat, cum) 95.24% of Total
         .          .     91:           return E
         .          .     92:   }
         .          .     93:
         .          .     94:   if x.Sign() < 1{
         .          .     95:           x = (&big.Int{}).Neg(x)
         .       30ms     96:           E = (&big.Int{}).Exp(g, x, n)
         .          .     97:           if 1 != Gcd(E, n).Int64(){
         .          .     98:                   log.Printf("h_r is not prime with n")
         .          .     99:                   return nil
         .          .    100:           }
         .          .    101:
         .       20ms    102:           E = (&big.Int{}).ModInverse(E, n)
         .          .    103:           E = (&big.Int{}).Mod(E, n)
         .          .    104:
         .          .    105:   }else {
         .      350ms    106:           E = (&big.Int{}).Exp(g, x, n)
         .          .    107:   }
         .          .    108:
         .          .    109:   return E
         .          .    110:}
         .          .    111:
如上所示,base.Exp 总计占用了 95.24% 的cpu时间, 而整个函数内最耗时的就是 big.Exp() 函数。这就给作者制造了个难题,因为在本模块中涉及到大量的指数运算,而且输入数据都较大(平均 512bit)。
-
因为本模块的功能相对比较简单,所以比较容易的定位到了问题的所在,接下来我们要想办法进行调优。
因为本模块目前是纯粹的算法模块,可以考虑进行并发改造,来发挥go协程的特点,尤其是在调用base.Exp的部分中。但作者将尝试并发改造后发现改造的结果并不理想,因为使用channel进行同步导致阻塞,‘抵消’了多协程带来的性能提升。另外一个思路就是尽量避免big.Exp指数运算,即将指数型运算转换为其他时间复杂度较低的运算,多协程是利用go本身的特性和cpu的多核运算。而这一种方法则纯粹是从数学角度上进行优化,并不具有普适性。改造后再进行测试显示结果如下:
 D:\gopath\src\github.com\utxo\balance>go test -run=None -bench=Va
 goos: windows
 goarch: amd64
 pkg: github.com/utxo/balance
 BenchmarkTransferProofValidator-4            200           5096903 ns/op
 PASS
 ok      github.com/utxo/balance 3.753s
虽然在零知识证明校验过程中多协程并未带来显著的效果提升,但在零知识证明生成的过程中起到了很大的作用。
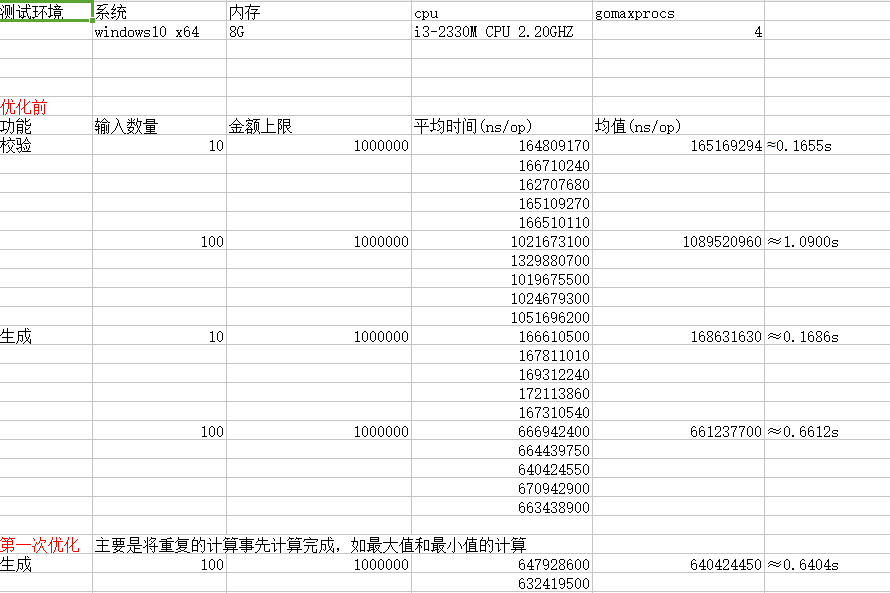
优化结果


 浙公网安备 33010602011771号